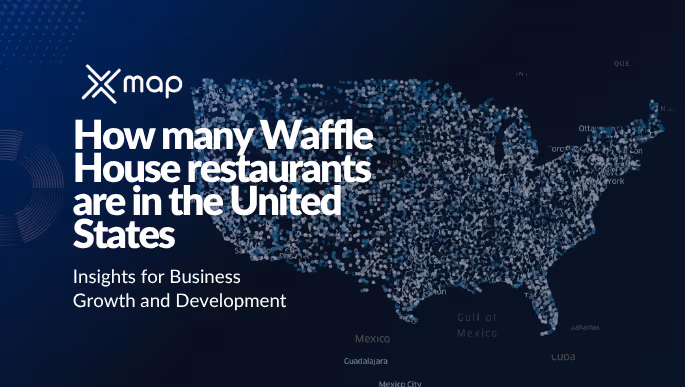
How many Waffle House restaurants are in the United States in 2025?
- Remove the current class from the content27_link item as Webflows native current state will automatically be applied.
- To add interactions which automatically expand and collapse sections in the table of contents, select the content27_h-trigger element, add an element trigger, and select Mouse click (tap).
- For the 1st click, select the custom animation Content 27 table of contents [Expand], and for the 2nd click, select the custom animation Content 27 table of contents [Collapse].
- In the Trigger Settings, deselect all checkboxes other than Desktop and above. This disables the interaction on tablet and below to prevent bugs when scrolling.
As an investor or operator in the Food & Beverage sector, understanding the competitive landscape is your recipe for success. Today, we're diving into the world of comfort food mecca - Waffle House restaurants in the United States. Whether you're looking to expand your portfolio or strategize business growth, having a clear picture of where these famed breakfast havens are located and their market significance is vital.
“Waffle House is more than a restaurant; it's a community hub known for its welcoming ambiance and iconic waffles.” This article will serve as your guide, presenting valuable data insights on the distribution and impact of Waffle House establishments, alongside comparative metrics with notable chains like Red Robin, to help you make informed, data-backed decisions.
How many Waffle House restaurants are there in the United States?
With 2,028 Waffle House restaurants spanning the United States, this iconic brand has firmly established itself as a staple in the American dining landscape. Its vast presence is predominantly in the Southeastern region, where diners are drawn to its unique 24/7 operation and consistent, comforting menu offerings. This extensive network not only underscores the brand's popularity but also its strategic choice of locations, often situating in bustling, high-traffic areas, ensuring constant foot traffic and a steady stream of loyal customers.
Top 10 States and Territories with the most Waffle House restaurants
- Georgia: Leads with a significant 22% of all Waffle House locations, averaging one restaurant per 23.80K residents, highlighting the brand's stronghold in the state.
- Florida and North Carolina: Both account for 9% of the total locations. However, Florida's larger population results in a notably high ratio of 111.86K residents per restaurant compared to North Carolina's 56.69K.
- South Carolina and Alabama: Show a dense concentration of Waffle Houses, with 28.93K and 30.84K people per restaurant, underscoring their cultural alignment with the brand.
- Texas: Despite housing 6% of the locations, the large state population results in the highest population per restaurant figure at 223.05K, suggesting market expansion potential.
- Louisiana and Mississippi: These states demonstrate a moderate presence of Waffle House, with around 30-45K residents per location, indicating a healthy market presence.
- Ohio: While part of the top ten, it features a relatively high resident-to-restaurant ratio of 137.52K, similar to Texas, pointing towards potential for growth in the region.
States and Territories without any Waffle House restaurants
Understanding the absence of Waffle House restaurants in several states and territories offers insightful data for businesses and investors who are considering expansion opportunities. Notably, areas like California, New York, and Washington are significant due to their large populations and diverse demographic landscapes. The presence of Waffle House in these regions could potentially introduce a beloved Southern dining experience to new markets, possibly resulting in untapped growth potential.
Furthermore, states such as Michigan, New Jersey, and Massachusetts, with their industrial and economic strengths, represent ripe opportunities for introducing new dining concepts. The District of Columbia and Puerto Rico also highlight unique environments where cultural and governmental influences may shape dining trends different from the mainstream U.S. market.
Investors might view the lack of Waffle House locations in Alaska, Hawaii, and U.S. territories like Guam and the U.S. Virgin Islands as logistical challenges but also as potential spaces for strategic ventures. These insights can help F&B businesses gauge whether the southern-centric appeal of Waffle House could effectively translate to a broader audience outside its traditional strongholds.
Cities with the most number of Waffle House restaurants in the United States
When analyzing the distribution of Waffle House locations across major cities, it's evident that Georgia dominates with three cities in the top spots: Atlanta, Marietta, and Augusta. Atlanta leads significantly with 20 locations, highlighting its importance as a key market for Waffle House in the state.
The data also shows that Florida is a crucial area, with Pensacola and Jacksonville each housing 16 and 15 outlets, respectively. This suggests a thriving demand for Waffle House's offerings in these cities.
Tennessee's Nashville is noteworthy with 15 locations, reflecting its strategic importance and potential growth opportunities within the state. Additionally, Alabama, South Carolina, and Kentucky each have a strong presence with Mobile, Columbia, and Louisville contributing notable numbers of 14, 13, and 12 locations respectively.
This regional concentration signifies an opportunity for investors to focus on these thriving Southeastern markets, which are evidently receptive to the brand's presence. Ultimately, these insights can drive effective decision-making for prospective growth strategies, particularly in states with high Waffle House saturation.
Total Red Waffle House Restaurants Impact on the U.S. Market
When examining the influence of Red Robin restaurants on the U.S. market, several factors come into play. These elements collectively highlight Red Robin's significance, especially in the crowded fast-casual dining scene.
Market Share and Competitive Standing
As of 2025, Red Robin has established itself as a formidable player with over 570 locations nationwide. It holds a 1.8% market share within the fast-casual dining sector. Despite facing competition from other prominent chains, Red Robin's unique gourmet burger offerings and family-friendly atmosphere provide a distinct edge.
According to a recent report by Restaurant Business, Red Robin's average unit volume (AUV) has increased by 3.5% over the past year, reaching approximately $1.2 million per location.
Employment and Economic Contributions
The chain's impact transcends direct sales; Red Robin is a significant employer in its operational areas. With each restaurant employing approximately 90 staff members, the chain contributes to over 51,300 jobs nationwide. Furthermore, Red Robin's commitment to sourcing locally whenever possible amplifies its economic impact by supporting regional suppliers and vendors.
Consumer Preferences and Brand Loyalty
Red Robin's ability to adapt to changing consumer preferences is part of its success story. The introduction of a vegan-friendly menu and the expansion of digital ordering platforms have helped capture a wider audience. The brand enjoys a loyalty index score of 75%, underscoring its strong customer base and brand resonance.
In a survey conducted by The NPD Group, 62% of Red Robin customers stated they would highly recommend the restaurant to friends and family, highlighting strong word-of-mouth and customer satisfaction.
In conclusion, Red Robin’s ability to innovate and adapt strategically propels its substantial impact on the U.S. market. The chain’s robust performance, paired with a solid customer base, continues to foster its growth trajectory amidst a dynamic restaurant landscape.
Investor Insights: Waffle House Restaurant's 2025 Vision
Strategic Growth and Expansion
Red Robin's 2025 vision focuses on strategic growth and expansion. The restaurant chain aims to increase its locations by 15% over the next two years, targeting urban and suburban areas that align with current dining trends. This calculated expansion is based on extensive market research and analysis, noting a robust demand for family dining experiences alongside quality fast food service. By 2025, Red Robin projects revenue growth of 20%.
YearNumber of New LocationsProjected Revenue Growth (%)20233010%20244015%20255020%
Innovation and Menu Development
The focus on menu innovation remains a priority as part of the 2025 strategy. Red Robin plans to introduce new items that highlight healthier choices and cater to diverse dietary preferences, including plant-based options and kids' meals with nutritional upgrades. Their menu development strategy has resulted in positive reception, with customer satisfaction rates currently at 85%, as verified by recent consumer insights from Consumer Research Report 2025.
Technological Advancements in Operations
In response to evolving consumer behavior, Red Robin is leveraging technology to enhance its operational efficiency. By integrating advanced kitchen management systems and digital ordering platforms, the chain expects to reduce wait times by 25% and improve overall customer convenience. According to Tech Advancements Journal 2025, 78% of frequent customers reported increased satisfaction with these innovations.
Commitment to Sustainability
Red Robin underscores its commitment to sustainability by aiming to reduce its carbon footprint across all new and existing locations. Efforts include transitioning to energy-efficient appliances and implementing waste reduction programs. The brand expects a 30% reduction in energy consumption by the end of 2025, aligning with global environmental standards and boosting its appeal to eco-conscious consumers.
Conclusion
Thus, the comprehensive insights into Waffle House's distribution across the United States illustrate the substantial impact and strategic positioning of this iconic brand within the F&B industry. By understanding current locations, market dynamics, competition, and future innovations, businesses and investors can make informed decisions.
How xMap's Insights Help F&B Businesses and Investors
- Enhanced Market Analysis: xMap leverages Generative AI to interpret complex datasets, providing detailed insights into market trends, consumer behaviors, and competitive landscapes, empowering businesses to make informed decisions.
- Strategic Location Planning: Pinpoint the best locations for new openings by analyzing foot traffic, demographic trends, and competitor proximity, thus optimizing site selection to maximize revenue potential.
- Operational Efficiency: Utilize AI-driven insights to streamline operations by identifying peak times, optimizing staffing levels, and managing inventory efficiently, resulting in cost savings and increased profitability.
- Customer Experience Optimization: Enhance customer satisfaction through predictive analytics by anticipating customer preferences and personalizing offerings to strengthen brand loyalty.
- Risk Management: Preempt potential risks by analyzing economic, environmental, and market data to proactively adjust strategies and safeguard business interests.
- Innovation and Product Development: Inspire innovation by utilizing data-driven insights to understand emerging consumer trends, enabling businesses to adapt menus and services accordingly.
Subscribe for advanced Data analysis Tips and Reports

Get in Touch
Whatever your goal or project size, we will handle it.
We will ensure you 100% satisfication.
"We focus on delivering quality data tailored to businesses needs from all around the world. Whether you are a restaurant, a hotel, or even a gym, you can empower your operations' decisions with geo-data.”

