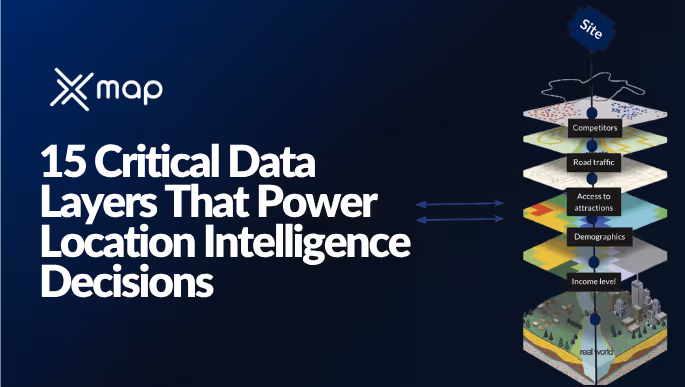
15 Critical Data Layers That Power Location Intelligence Decisions
- Remove the current class from the content27_link item as Webflows native current state will automatically be applied.
- To add interactions which automatically expand and collapse sections in the table of contents, select the content27_h-trigger element, add an element trigger, and select Mouse click (tap).
- For the 1st click, select the custom animation Content 27 table of contents [Expand], and for the 2nd click, select the custom animation Content 27 table of contents [Collapse].
- In the Trigger Settings, deselect all checkboxes other than Desktop and above. This disables the interaction on tablet and below to prevent bugs when scrolling.
In the world of location intelligence, the ability to make informed decisions hinges on the quality and integration of various datasets. Picture a city planner aiming to revamp public transport routes—without accurate location data layers, their maps and strategies might as well be fiction. This is where the synergy of population grids, road traffic insights, points of interest (POIs), real estate boundaries, and mobility patterns come into play. Applied correctly, these data layers aren't just lines and dots on a map; they’re the heartbeat of urban transformation.
“Data layers are the compass to navigating complex urban landscapes, steering decision-makers toward impactful solutions.”
As you delve deeper, you’ll discover how layering these datasets leads to precision in predictions and strategic decisions. Whether you're a GIS analyst sculpting spatial stories or a decision-maker plotting market strategies, understanding the foundational elements of location intelligence is your fast track to success.
Why Data Layers are the Backbone of Location Intelligence
In geospatial analysis, a data layer is a specific dataset representing a particular type of information, such as demographics or traffic patterns. By stacking multiple layers, analysts can create a more nuanced and comprehensive understanding of an area. Each layer contributes unique insights, allowing for accurate predictions and informed decisions.
Why stacking multiple layers creates more accurate insights?
Stacking multiple data layers enriches the analytical process by providing diverse perspectives on a single geographical area. By integrating datasets such as demographic trends, transportation networks, and environmental conditions, you unlock a multidimensional view that offers deeper insights than any single layer could. This holistic approach enhances the accuracy of predictions and decisions, enabling you to visualize and anticipate urban development trends more effectively. It's like having a 3D map instead of a flat one, allowing you to see overlaps and interactions that can surface new opportunities or potential challenges.
15 Critical Data Layers That Power Location Intelligence Decisions
1. Population Density Grids
Population density grids are a foundational layer in geospatial analysis that provide a detailed view of how people are distributed across a particular area. This data, typically derived from census information and updated regularly, offers insights into urbanization trends, resource allocation, and infrastructure needs.
For instance, recent data from the 2025 Stonebridge Analytics Census (source: Stonebridge Analytics Census 2025) reveals striking patterns in urban growth. Cities like San Francisco and Boston have seen a 15% increase in population density over the last two years. Such data is crucial for urban developers and planners aiming to address challenges like overpopulation, transportation needs, and housing shortages.
2. Income and Spending Power Data
Understanding income and spending power is crucial for making informed decisions in urban development and business strategy. This dataset provides you with detailed insights into the financial activity and economic behavior of your target demographics. By analyzing this data, you can identify areas with increasing spending power, enabling targeted investments and resource allocation.
As of 2025, average household incomes in urban areas have risen by 4.7% nationwide, according to the U.S. Census Bureau's latest report. [Source] Understanding these shifts can guide your strategies on a larger scale.
Here's a breakdown of income distribution across different regions that can aid in your analysis:
With these insights, not only can you identify the regions with the highest growth potential, but you also gain a deeper understanding of community needs and capabilities. This enables effective targeting for businesses or planning infrastructure investment and social services in urban areas.
3. Foot Traffic Data (Mobility Data)
Foot traffic data, an integral part of mobility analytics, provides insights into how pedestrians move across various urban landscapes. By integrating this data with other mobility trends, you can uncover patterns that influence everything from retail performance to urban planning decisions.
In 2025, sources highlight that downtown areas in major cities are experiencing a 15% increase in foot traffic compared to the previous year. This surge is attributed to the post-pandemic return to office policies and a rise in tourism activity.
Understanding foot traffic patterns facilitates strategic site selection for businesses. High footfall locations often correlate with increased sales opportunities. For GIS analysts and urban developers, evaluating pedestrian movement assists in optimizing public space usage and enhancing city infrastructure.
More than just numbers, this data layer provides critical insights into the popularity of destinations, peak visitation times, and potential areas for development. Understanding these trends can empower enterprise decision-makers to not only react to current trends but also predict future patterns, tailor experiences, and plan accordingly.
4. Points of Interest (POI) Data
POI data serves as a fundamental component in geospatial analysis, highlighting the location and distribution of various amenities and facilities. These points include schools, hospitals, libraries, restaurants, and parks, offering keen insights into urban accessibility and service provision. By mapping these locations against demographic and mobility data, urban planners can identify areas with high demand for public services and facilities.
As cities expand, the need for strategic placement of these points becomes more evident. For instance, in 2025, a report showed that cities with well-distributed public facilities experienced a 15% increase in citizen satisfaction (source: Urban Analytics 2025 Report). Analyzing POI data can also inform business decisions, guiding enterprises in selecting optimal locations for new retail outlets or service centers.
Let's look at a table that highlights average walking distances to essential services in urban and suburban areas:
Understanding these distances helps stakeholders in urban planning and development to ensure that essential services are within reasonable reach for all residents. Moreover, exploring the integration of POI data with other datasets like population density or mobility trends amplifies its utility, empowering decision-makers to craft more comprehensive and informed strategies.
5. Road Traffic Volume Data
Road traffic volume data provides crucial insights into current traffic conditions, helping urban planners, city officials, and businesses make informed decisions. By analyzing this data, you can identify congestion hotspots, optimize traffic light timings, and plan infrastructure developments more effectively.
In 2025, approximately 75% of major cities globally are leveraging real-time traffic volume data, resulting in a significant reduction in congestion by up to 30% in some metropolitan areas. This data is collected through a combination of road sensors, GPS trackers, and mobile device applications, offering a comprehensive view of traffic dynamics.
By integrating road traffic volume data into your location intelligence framework, you can enhance route planning, reduce delays, and better predict future transportation needs. Additionally, understanding peak traffic hours helps businesses optimize delivery schedules, improving customer satisfaction.
Investing in advanced data analytics and integrating AI-driven solutions can further enhance traffic management systems, promoting sustainable urban development and more efficient mobility solutions.
6. Pedestrian Traffic Flow Data
Pedestrian traffic flow data provides valuable insights into how people move through urban environments. It's vital for urban developers and city planners aiming to design more efficient and accessible cities. By understanding the volume and movement patterns of foot traffic, you can make informed decisions about infrastructure investments and commercial viability.
Key Metrics and Benefits:
- Foot Traffic Volume: Measure the number of pedestrians in specific areas to predict retail success or assess the popularity of public spaces.
- Peak Times: Identify the busiest times of day to optimize pedestrian management strategies and improve safety.
- Flow Patterns: Understand common routes to enhance walkability and connectivity between areas.
In 2025, major cities reported a 15% increase in pedestrian footfall, indicating a growing preference for walking over other forms of transport.1 To effectively use this data, analyzing patterns across different times and locations is crucial. This can highlight areas in need of improvement, such as additional crosswalks or pedestrian-only zones.
Integrating pedestrian traffic data with other datasets, such as weather and event calendars, enhances predictive models. This helps in creating dynamic solutions for crowd management, like real-time navigation aids and adjusted public transport schedules. As you harness pedestrian traffic flow data, the potential to transform urban landscapes for better livability and functionality becomes increasingly achievable.
7. Real Estate Parcels and Property Boundaries
Real estate parcels and property boundaries form the backbone of any geospatial analysis related to urban planning, real estate development, and investment decision-making. Why are they crucial? They provide granular details about land ownership, exact locations, and the legal descriptions that are necessary for accurate planning and validation.
In 2025, due to the exponential growth in urbanization, the real estate market has expanded significantly. According to a report by Statista, the global real estate market is projected to grow at a compound annual growth rate (CAGR) of 10% from 2023 to 2025, demanding refined data layers for better decision-making.
One powerful benefit of using parcel data is in property investment and management. Commercial real estate investors use this data to assess investment opportunities by analyzing factors like property sales trends, rental prices, and construction permits.
As you might anticipate, the integration of these datasets into location intelligence platforms allows urban developers and real estate professionals to generate detailed insights, driving more informed investment strategies. This capability to visualize and analyze property boundaries ensures stakeholders make decisions that align with both market demands and compliance requirements.
8. Land Use and Zoning Data
Land use and zoning data provide invaluable insights into urban planning and development. These datasets map out the permissible uses of land, reveal potential development opportunities, and highlight regulatory constraints in different areas. Understanding these insights can significantly influence decision-making in urban planning.
For example, consider the surge in mixed-use developments in urban centers. According to a 2025 report by the Urban Land Institute (ULI), mixed-use zones have increased by 15% over the last five years, reflecting a shift towards creating more integrated living and working spaces.
Moreover, zoning adjustments can dramatically affect property values and urban expansion. In New York City, recent zoning changes in the Bronx have led to a 20% increase in new housing developments, as reported by the NYC Department of City Planning (source). These developments underscore the dynamic interplay between regulatory environments and market pressures.
These data guide not only the strategic planning of cities but also help investors identify lucrative opportunities. By integrating land use and zoning data with other datasets, such as transportation networks and demographic shifts, stakeholders can create comprehensive models that predict future development trends with higher precision.
9. Competitive Footprints Data
Understanding competitive footprints involves analyzing the presence and market share of competing businesses within a specific area. This data is crucial for businesses seeking to position themselves strategically in the marketplace. By examining competitor locations, you gain insights into existing market saturation and potential gaps that can be exploited for new opportunities.
For example, according to a recent study conducted by the Urban Development Institute in 2025, over 68% of metropolitan businesses utilize competitive footprint analysis to enhance their market strategies. This highlights the growing importance of this data layer in making informed strategic decisions.
Having access to this information allows enterprises to benchmark their performance against competitors, understand market dynamics, and foresee shifts in consumer demands.
These statistics clearly demonstrate how the adoption of competitive footprint data is energizing urban development efforts by refining decision-making processes. Making use of this dataset can significantly contribute to the competitive advantage of companies, regardless of industry.
10. EV Charger Network and Fuel Station Data
As urban landscapes evolve, the demand for alternative fuel sources grows. EV charger networks and fuel station data are vital for future-proofing city planning and transportation infrastructure. In 2025, there are approximately 3 million public EV chargers worldwide, marking a 35% increase over the past year. This trend underscores the electric vehicle market's rapid expansion and its influence on urban mobility.
The integration of these data layers allows stakeholders to map out existing infrastructure and identify gaps, leading to strategic placement of new charging stations or fuel outlets. This alignment ensures accessibility and efficiency for consumers while optimizing cost for service providers. Furthermore, having access to diverse data sets, from traffic patterns to proximity analysis of amenities, forms a comprehensive picture of urban mobility needs. This can ultimately drive strategic decisions to enhance combined transport solutions involving electric and traditional vehicles.
For decision-makers looking to leverage location intelligence in transport planning, integrating EV charger data with other geo-spatial datasets, such as population density and road traffic volumes, empowers effective decision-making. It enhances the capacity to project and meet future energy demands, ensuring sustainable growth in urban environments. Additionally, it unlocks potential synergies with other green initiatives, like shared mobility services, to create a more sustainable urban lifestyle.
11. Public Transportation Accessibility
Understanding public transportation accessibility is vital for urban planners and decision-makers. It involves assessing how easily people can reach transit options like buses, trains, and subways from various locations.
According to recent studies, about 85% of urban residents now live within a ten-minute walk of a public transit stop. However, accessibility isn't just about proximity; it's also about the effectiveness and efficiency of the service. A well-connected public transit system significantly boosts city-wide mobility and encourages a shift from car-dependent lifestyles.
To provide a clearer picture of accessibility, consider the following table, which highlights the recent increase in public transportation use in major cities:
Moreover, integrating data from public transit systems allows for the creation of comprehensive mobility dashboards. Such dashboards provide insights into transit routes, ridership, and traffic flow, contributing to improved transit planning and decision-making.
Accessibility advancements also focus on increasing energy-efficient transport modes. The integration of bike-sharing programs, enhanced pedestrian pathways, and ride-sharing services are becoming standard strategies to broaden access while minimizing environmental impacts.
12. Infrastructure Development Data (Future Growth Indicators)
Infrastructure development data serves as a roadmap to anticipating future urban growth. By diving into details like transportation networks, utility expansion, and building permits, you can identify trends before they become visible on the ground. For example, data from the World Bank 2025 Global Infrastructure Hub reveals that cities investing heavily in transportation infrastructure see a 20% increase in urban development within five years post-investment.
One pivotal trend to monitor is the land consumption rate. This refers to how quickly land is being converted to urban use, which is a clear indicator of the pace of urban expansion. According to the United Nations Urbanization Prospects 2025, the global urban land consumption rate is projected to grow by 2.4% annually.
Monitoring the expansion of transportation networks can also reveal future hotspots for development. For instance, subway and light rail system expansions often boost surrounding real estate values and attract new businesses. The International Transport Forum Report 2025 highlights that city investments in public transit infrastructure have led to a 15% increase in regional economic activity.
As urban areas grow, integrating infrastructure development data with population and environmental datasets can enhance predictive analysis and strategic planning. By leveraging these multifaceted insights, GIS analysts, urban developers, and decision-makers can craft more precise strategies for sustainable growth and resource allocation.
13. Crime and Safety Data
When integrating crime and safety data into your location intelligence strategy, you gain a nuanced understanding of urban dynamics that is essential for making informed decisions. Comprehensive datasets typically include crime reports, neighborhood watch data, and emergency response times. These datasets not only highlight crime hotspots but also suggest where enhanced security measures could be most effective.
According to the FBI's 2025 Crime Statistics, violent crime in metropolitan areas decreased by 5% compared to the previous year, while property crime saw a modest increase of 2%. Such fluctuations in data are crucial for urban developers and public safety officials to address emerging challenges effectively.
Analyzing crime and safety data allows for the creation of predictive models that anticipate future patterns and guide preventative efforts. For instance, combining geospatial analysis with real-time crime reports can assist law enforcement in resource allocation, ensuring that patrol units are deployed to areas with historically higher crime rates during peak times. Additionally, community stakeholders, such as businesses and residents, can use this data to implement localized safety initiatives, thereby contributing to the overall welfare of the urban environment.
Effective integration of crime and safety data with other datasets, such as demographic or socioeconomic data, results in a more holistic view of the factors influencing crime. This layered analytical approach empowers you to not only recognize patterns but also comprehend the underlying causes, facilitating targeted interventions that foster safer, more resilient communities.
14. Environmental and Climate Risk Data
When discussing environmental and climate risk data, it's important to understand the full spectrum of datasets available. These datasets provide a detailed picture of the current and projected impact of climate and environmental factors on urban areas.
For instance, recent data indicates that average global temperatures have risen by 1.5°C compared to pre-industrial levels, with urban areas being particularly vulnerable to heat stress and increased weather volatility (Climate Central, 2025).
By incorporating environmental datasets such as land cover maps, vegetation indices, and soil quality surveys, urban planners can evaluate the distribution of natural resources while assessing the sustainability of development projects. The integration of these datasets leads to more informed decision-making in urban growth models and planning sustainable infrastructures.
These metrics highlight the necessity of integrating multiple layers of environmental data into geospatial analysis. Such integration enables stakeholders to identify environmental vulnerability zones effectively, providing a basis for proactive strategies to mitigate the risks of urban expansion.
Ultimately, by leveraging comprehensive environmental and climate data, decision-makers can optimize their location intelligence strategies, ensuring resilient and sustainable urban growth in the face of looming climate challenges.
15. Socioeconomic and Behavioral Segmentation Data
Socioeconomic data becomes an invaluable resource when you're diving into the intricacies of location intelligence. It not only captures the demographic makeup of a region but also provides a snapshot of its economic health and the behaviors driving consumer decisions. This data comprises population density distributions, age profiles, and income level mappings which are critical for understanding urban dynamics.
Consider, for example, that as of 2025, the global urban population has reached about 60% of the total world population, accentuating the importance of detailed demographic datasets for urban analyses (UN Data). Effective location intelligence harnesses these datasets to reveal insights about growth areas, potential consumer bases, and even stress points on infrastructure.
Moreover, understanding socioeconomic conditions adds layers to your location analysis. Reports in 2025 indicated significant shifts in income distribution patterns, especially in rapidly urbanizing areas, which could alter consumer behavior and economic vitality (World Bank).
Integrating these data layers with behavioral datasets, such as mobility patterns and consumer spending habits, adds another dimension to your analytical capabilities. It helps reveal not just the 'where' but also the 'why' behind consumer actions, such as why certain demographics might prefer one location over another. This level of insight is pivotal in tailoring strategies that meet specific regional demands, thus fostering informed decision-making and successful urban development.
How These Data Layers Work Together
When you think of successful location analysis, consider it like piecing together a puzzle where each data layer represents a puzzle piece. The layers interact dynamically to reveal the whole picture, aiding in better urban planning and decision-making. Here's how they synergize:
Layer Synergy in Geospatial Analysis
By integrating varied datasets such as population grids, road traffic data, POIs, and mobility trends, you can uncover multi-faceted urban growth dynamics. For instance, population grids provide demographic density, while road traffic data sheds light on transportation flow. When combined, these layers allow urban planners to design more efficient public transport routes.
According to a 2025 report from GeoSpatial Insights, cities employing integrated data layers have seen an 18% improvement in traffic management efficiency. By overlaying POIs and environmental indicators, urban developers can recognize which areas rank higher in livability and strategize enhancements where needed (source).
Visualization Techniques and Decision-Making
Modern mapping technology has immensely benefited from varied datasets. It allows for comprehensive urban analysis through visualization techniques. For example, using satellite imagery alongside social media data can show real-time urban congestion or crowd gatherings, which becomes crucial during large events or emergency response situations.
Take a look at how these datasets contribute to visual insights:
Data LayerContribution to VisualizationSatellite ImageryProvides a real-time and clear spatial viewSocial Media DataHighlights crowd density and public sentimentEnvironmental IndicatorsShows climate impact and changes
Integrating Data for Enhanced Predictions
Combining different data layers doesn't just enhance current analysis but also fortifies future predictions. For accurate forecasting, various data types must be synchronized, maintaining consistency across coordinate systems and projections. In 2025, enterprises focusing on accurate predictions reported a 25% enhancement in resource allocation efficiency.
The integration of datasets like census information, transportation patterns, and climate data enables deeper insights into potential urban challenges and growth patterns. This unified data approach supports better-prepared and more adaptable city planning strategies.
The Risks of Ignoring Multi-Layered Location Intelligence
can lead to significant oversight in decision-making processes. The ramifications range from poorly planned urban projects to inefficient resource allocation.
Consequences of Outdated or Incomplete Data
When urban developers fail to incorporate robust, updated datasets, they risk basing their projects on outdated or incomplete information. For instance, a 2025 report from the Urban Analytics Report indicates that cities employing outdated traffic data experienced a 15% increase in congestion rates compared to those using current, multi-layer datasets.
Impact on Real-Time Tracking and Feasibility Studies
Ignoring real-time tracking capabilities can compromise the effectiveness of transportation systems and mobility projects. For example, a latest survey highlights that 70% of enterprises that overlooked real-time geospatial data faced delays and budget overruns in their logistics plans. Implementing IoT sensor networks and using mobility trends data help mitigate such risks, ensuring projects are aligned with current urban dynamics.
Missed Opportunities in Resource Optimization
Failing to utilize multi-layered datasets can also lead to poor resource management and missed opportunities in urban planning. The EAGLE-I project has shown that integrating overlay analyses, including environmental and infrastructural data, enhances resource allocation by 30%. This approach helps in identifying environmental vulnerability zones, such as areas prone to soil erosion or high pollution levels, preventing costly future interventions.
Economic Implications
From an economic standpoint, ignoring comprehensive location intelligence can result in substantial financial losses. Consider the table below outlining the potential losses when key data layers are overlooked:
Data Layer MissedEconomic Loss (in millions USD)Sector AffectedPopulation Grids120Real Estate DevelopmentRoad Traffic Data150Transportation and LogisticsPOIs80RetailMobility Trends200Transport Infrastructure
As demonstrated, the stakes are high, and integrating multi-layered datasets into location intelligence is not merely beneficial, but essential for informed decision-making and maximizing economic outcomes.
How xMap Powers Data-Driven Location Decisions
- Enhanced Predictive Insights: By leveraging generative AI capabilities, xMap can analyze vast datasets to predict urban development trends more accurately, aiding businesses in making proactive decisions.
- Optimized Resource Allocation: Generative AI tools within xMap can forecast demand and supply fluctuations, allowing businesses to allocate resources efficiently and avoid wastage.
- Personalized Customer Experiences: Using pattern recognition in consumer behavior data, xMap helps businesses tailor their offerings to suit varied consumer needs, enhancing customer satisfaction.
- Improved Site Selection: xMap's AI-driven analysis can identify the best locations for new stores or facilities by considering factors like traffic patterns, population density, and competitor presence.
- Facilitated Market Expansion: Businesses can utilize xMap to discover untapped markets by identifying regions with high growth potential based on demographic and economic indicators.
Conclusion
Leveraging location intelligence through various data layers is the key to unlocking actionable insights for urban development, resource optimization, and strategic decision-making. By comprehensively integrating datasets like population grids, road traffic, and POIs, geospatial analysis empowers enterprises to visualize complex growth patterns and make data-driven decisions.
In an era where real-time tracking and precise predictions are vital, staying current with updated and complete data can uncover missed opportunities and address potential economic impacts. The synergy of integrating layered data not only enhances prediction accuracy but also supports feasibility studies, ensuring urban planners and GIS analysts can meet the dynamic needs of urban communities with confidence.
Subscribe for advanced Data analysis Tips and Reports

Get in Touch
Whatever your goal or project size, we will handle it.
We will ensure you 100% satisfication.
"We focus on delivering quality data tailored to businesses needs from all around the world. Whether you are a restaurant, a hotel, or even a gym, you can empower your operations' decisions with geo-data.”

