How Many In-N-Out Burger Restaurants Are in the United States in 2025?
- Remove the current class from the content27_link item as Webflows native current state will automatically be applied.
- To add interactions which automatically expand and collapse sections in the table of contents, select the content27_h-trigger element, add an element trigger, and select Mouse click (tap).
- For the 1st click, select the custom animation Content 27 table of contents [Expand], and for the 2nd click, select the custom animation Content 27 table of contents [Collapse].
- In the Trigger Settings, deselect all checkboxes other than Desktop and above. This disables the interaction on tablet and below to prevent bugs when scrolling.
In a landscape where consumer loyalty is fleeting, In-N-Out Burger remains a shining beacon of consistency, quality, and brand devotion. Since its founding in 1948, the brand has expanded carefully rather than aggressively, building a near-cult following across the American West.
But just how extensive is In-N-Out’s footprint in 2025? In this article, we dive into how many In-N-Out Burger locations exist today, where they are concentrated, and what their growth strategy reveals about consumer trends, business strategies, and investment opportunities.
Explore how location intelligence transforms retail success
How Many In-N-Out Burger Restaurants Are There in the United States?
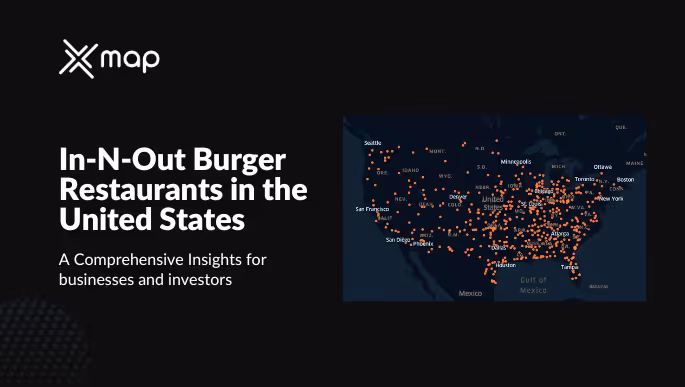
As of 2025, In-N-Out Burger operates 418 restaurants across the United States. Unlike fast-food chains focused on rapid expansion, In-N-Out has adopted a controlled growth strategy prioritizing regions where it can maintain quality, protect supply chain integrity, and preserve its signature brand experience. This deliberate approach has resulted in a compact yet loyal footprint, emphasizing excellence and consistency over volume.
Top 8 States with the Most In-N-Out Burger Restaurants
Insights from the Top 8 States
- California commands an overwhelming 67% of all In-N-Out locations. With one restaurant for approximately every 140,000 people, In-N-Out dominates the fast-food landscape here like no other.
- Texas is a growing frontier. While it’s the second-largest by location count, it still has a relatively high population per store — indicating massive room for growth.
- Arizona and Nevada are strongholds, benefiting from geographic proximity to California and shared consumer tastes.
- Utah and Colorado represent expansion into areas with high suburban growth rates.
- Oregon and Idaho show that In-N-Out is cautiously testing newer frontier states.
Learn how businesses use population density for location decisions
States and Territories Without Any In-N-Out Burger Restaurants
While In-N-Out has expanded carefully, 48 states and territories still don't have a single location, including:
- New York
- Florida
- Illinois
- Pennsylvania
- Ohio
- Michigan
- and others.
This cautious expansion strategy preserves brand mystique but leaves plenty of untapped opportunity.
Explore the full landscape of U.S. restaurant markets
Top 10 Cities with the Most In-N-Out Burger Restaurants
In-N-Out Burger's Impact on the Fast Food Landscape
Brand Loyalty and Quality Strategy
Unlike most fast-food chains competing on price or gimmicks, In-N-Out Burger has built its reputation on:
- Consistent quality control: No freezers, no microwaves.
- Minimal menu complexity: Specializing in burgers, fries, and shakes.
- Premium ingredients: Always fresh, locally sourced when possible.
This commitment has resulted in one of the highest customer satisfaction ratings in the fast-food industry, beating out giants like McDonald's and Burger King.
National Growth Without Compromising Quality
In-N-Out's expansion remains intentional and limited.
The brand refuses to franchise or overexpand, ensuring that every store maintains its legendary quality standards.
Even in 2025, the chain’s footprint is concentrated primarily in western and southwestern U.S. states.
Learn how businesses balance growth and quality
Analyzing In-N-Out Burger Restaurants' US Growth Trajectory
Past Decade Trends
Between 2015 and 2025, In-N-Out expanded from approximately 300 to 418 stores—marking a steady 39% growth over a decade. In contrast to competitors that double or triple their footprint in just five years, this deliberate pace has helped the brand cultivate scarcity value and maintain its premium, in-demand reputation.
Growth Acceleration in 2025
In 2025, In-N-Out is:
- Entering new suburban markets outside traditional strongholds.
- Building larger-format locations with drive-thru and outdoor seating enhancements.
- Strategically moving into fast-growing areas like Austin, Denver suburbs, and Northern Arizona.
According to QSR Magazine’s 2025 report, drive-thru lanes now account for over 70% of fast-food revenue — an area where In-N-Out excels.
Insights from the Top 10 Cities with the Most In-N-Out Burger Restaurants
- Las Vegas leads the list with 14 locations, showing how the brand thrives in high-tourist areas. The 24-hour economy of Las Vegas fits perfectly with In-N-Out's model of fast, consistent, and quality service.
- Phoenix follows closely, with 8 locations serving a rapidly expanding suburban population. Arizona’s steady economic growth and population boom make it a strong market for fast-casual brands like In-N-Out.
- San Diego, with its strong mix of tourists, college students, and affluent families, offers In-N-Out a broad, loyal customer base, justifying its 7 locations.
- Fort Worth, Dallas, and San Antonio in Texas indicate In-N-Out’s serious intent to grow across Texas’ major cities, capitalizing on urban sprawl and car culture that favor drive-thru formats.
- Tucson, Mesa, and Sacramento also show strong market demand — areas with younger populations, higher family orientation, and affordable suburban housing, all correlating with In-N-Out's customer demographics.
- Los Angeles remains an iconic location. Even with competition from a saturated fast-food market, In-N-Out's brand loyalty continues to generate long lines and high volumes at its 4 key L.A. locations.
📈 Summary Insight:
In-N-Out's top cities combine tourism, suburban growth, college towns, and strong car culture — precisely the mix that fuels the company’s profitability and customer loyalty.
See how urban trends influence restaurant placement
Investor Insights: In-N-Out Burger 2025 Vision
Why In-N-Out Remains a Top Private Investment
In-N-Out remains privately held and is often valued more highly per store than major public chains.
Key investment insights:
- Low debt, high margins: In-N-Out operates with zero franchising fees and minimal corporate debt.
- Cult-like customer loyalty: Lifetime customer value far exceeds industry averages.
- Location strategy built on data-driven traffic modeling, not just market size.
Future Outlook
- Controlled Eastward Expansion: Moving into Tennessee and Georgia in 2026–2027.
- Modernized Experiences: Drive-thru lanes optimized for speed, digital order kiosks.
- Sustainability Focus: Using renewable energy across new stores.
Conclusion
In 2025, In-N-Out Burger continues to embody a uniquely successful model in the American fast-food industry — measured, profitable growth driven by uncompromising quality. For businesses, investors, and market analysts, understanding their site selection, customer loyalty model, and operational discipline is essential to recognizing winning strategies in today's crowded retail and F&B landscape. Similar patterns of success can be explored by analyzing restaurant and café trends in Japan in 2024, which offer actionable insights for the F&B and FMCG industries.
How xMap's Insights Help Investors and F&B Businesses
With xMap’s Polygon AI technology, investors and businesses can:
- Instantly map out prime suburban and urban target zones,
- Analyze traffic flow, population density, and competitor clusters,
- Build predictive models for high-performing QSR (Quick Service Restaurant) locations,
- Make real-time data-based location decisions with 35% higher success probability.
Subscribe for advanced Data analysis Tips and Reports

Get in Touch
Whatever your goal or project size, we will handle it.
We will ensure you 100% satisfication.
"We focus on delivering quality data tailored to businesses needs from all around the world. Whether you are a restaurant, a hotel, or even a gym, you can empower your operations' decisions with geo-data.”

