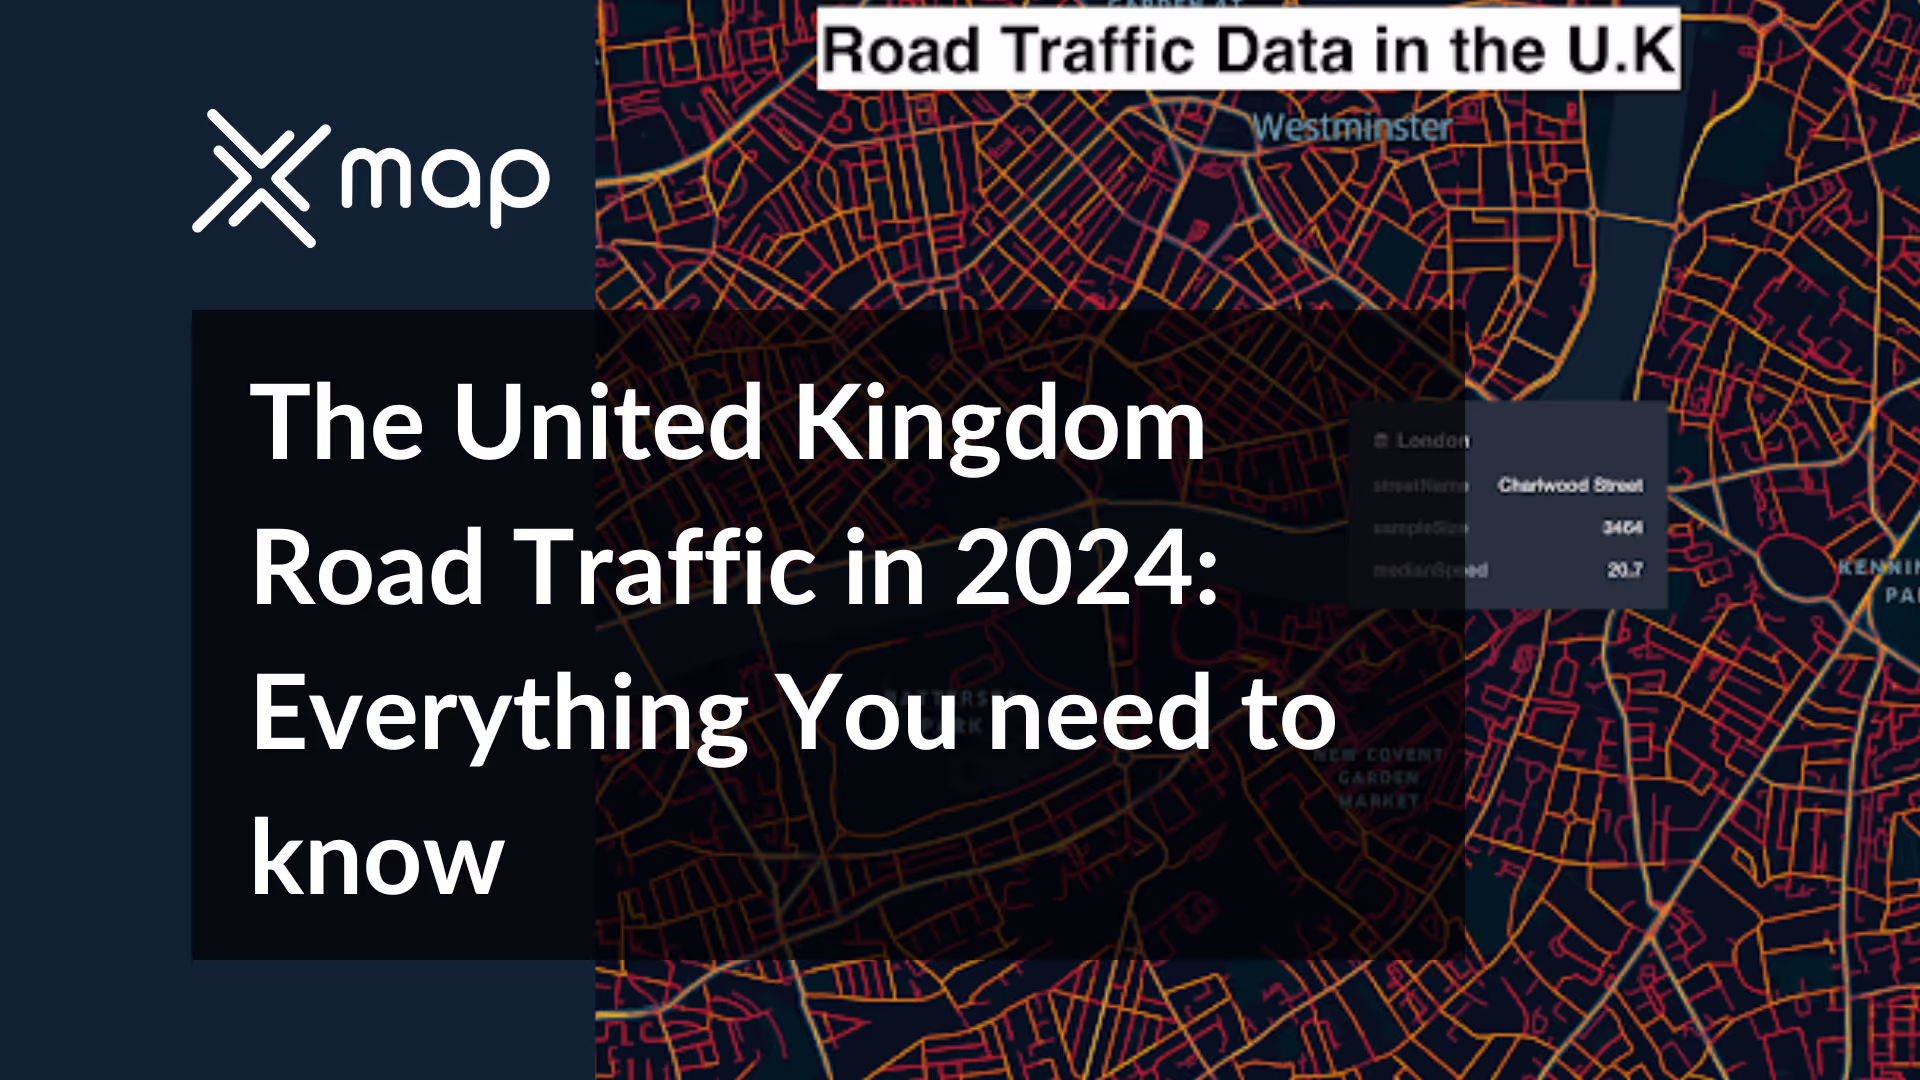
The United Kingdom Road Traffic in 2024: Everything You need to know
- Remove the current class from the content27_link item as Webflows native current state will automatically be applied.
- To add interactions which automatically expand and collapse sections in the table of contents, select the content27_h-trigger element, add an element trigger, and select Mouse click (tap).
- For the 1st click, select the custom animation Content 27 table of contents [Expand], and for the 2nd click, select the custom animation Content 27 table of contents [Collapse].
- In the Trigger Settings, deselect all checkboxes other than Desktop and above. This disables the interaction on tablet and below to prevent bugs when scrolling.
Welcome, enterprising soul! A deeper understanding of traffic flow, density, commuting patterns, and peak hours is a pivotal factor to your enterprise's ground-game. That's why you're here, isn't it? So, stay with us as we navigate through UK's bustling lanes and timetables, and unearth practical insights that matter to your business.
"The details of traffic and commuting patterns are not just numbers, but essential gears in the clockwork of modern businesses. Understanding them can help you optimise, strategise, and thrive."– Anonymous Business Strategist
We've compiled a thorough exploration, tailor-made for businesses like yours, to provide an in-depth understanding of all things 'traffic'. Whether you're a retail outlet examining shopper density, a logistics firm needing to predict traffic flow, or a tech company considering office location, decoding these patterns can be the competitive advantage your business needs. Fasten your seat belts, gear up, and let's dive into the hustle and bustle of UK traffic!
Decoding UK's Road Traffic Data
How absolutely wonderful that you're investing your precious time to master the nuances of UK's road traffic. Being able to read and comprehend traffic patterns will no doubt be a tremendous advantage for your business. So, let's dive in!
Traffic flow
Put simply, traffic flow is a fundamental concept that refers to the number of vehicles passing through a given point during a specific time interval. It's like taking a snapshot of a busy highway and counting the cars. This intricate dance of vehicles provides valuable insights into the overall health of the UK's transit infrastructure, indices of economic activity, and even the environmental impact of transport. Interesting, isn't it?
Traffic density
Now, let's introduce you to traffic density. Traffic density is essentially the number of vehicles on a stretch of road at any given moment. Think of this as finding out how congested a particular section of the road is. By understanding density, businesses can effectively plan their logistics, save on fuel costs, reduce shipment times, and ultimately increase customer satisfaction.
*Data sourced from the UK Department for Transport.
Community patterns
Oh, and then there's the matter of commuting patterns. Whether it's a daily office commute or school run, understanding these patterns can help you make smart business decisions such as where to open your next retail store, how to manage your supply chain, or where to target your next marketing campaign.
Peak hours
And then, we have peak hours - those dreaded times of day when traffic congestion is usually at its highest. While it's a commuter's nightmare, it's an invaluable data point for businesses. Keep your eyes on peak hours to plan delivery schedules, minimise downtime, and potentially avoid costly delays.
The above data showcasing the peak hours of various UK cities has been extracted from the official statistics provided by the Department for Transport, UK.
London's Rush Hour: A Detailed Analysis
Traditionally, rush hour is considered as the time when most people are commuting to and from work. However, we need a breakdown of specific times to truly understand the patterns and cope with them.
The significance of understanding rush hour goes far beyond just commuting. It can impact business operations, real estate value, and city development plans. For instance, businesses that rely on timely deliveries can plan their schedules to avoid hitting the peak hours. Real estate investors might consider traffic patterns while evaluating the desirability and value of properties. Meanwhile, city planners can use this data to design infrastructures that manage peak hour traffic effectively, enhancing daily life in London.
Visualizing UK's Traffic: Utilizing Data Through Maps & Tables
By employing data visualization tools in your strategy, you can dive deep into the UK's traffic analytics landscape. This allows you to explore and extract geographically specific traffic trends, uncovering detailed insights into commuting behaviors across various regions, cities, and even individual road segments. Such visibility supports more accurate decision-making around key factors like travel times, optimal routing, delivery scheduling, and broader transportation planning strategies.
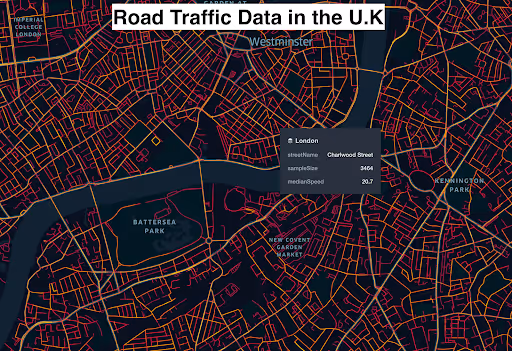
Road Traffic Data in the U.K.
This extensive data set provides an intricate understanding of traffic numbers, congestion points, and speed tendencies across varying types of roads. This includes everything from sprawling highways to intimate city streets. Such in-depth understanding is key for devising national transport strategies, performing road safety checks, and appreciating the nuances in regional traffic diversity.
Median Speed by Road Class
Let's delve into this tabulated information. On the left column, you see various classes of roads in the UK. These range from high-speed avenues like motorways and freeways, to roads of minor importance at a local level. Now, if you look to the right column, we've outlined the median travel speed, measured in kilometers per hour (km/h), for each type of roadway.
As you'd expect, motorways and freeways top the chart with a brisk median speed of 98.2 km/h. As we move down the hierarchy of road classes, the speeds tend to decrease. Major roads less important than motorways and other major roads facilitate comparatively slower speeds of 63.2 km/h and 36.3 km/h respectively. Variants of local roads, however vital they may be to the nearby communities, show lower speeds. Thus, while planning, whether for logistics operations or simple commuting, considering road type should be essential.
Eventually, we reach 'Local roads of minor importance,' which have the slowest median speed at just 12.3 km/h. This could likely be due to numerous factors such as road conditions, traffic constraints, and usage purpose.
This data is a simple yet fundamental tool in understanding how travel speeds vary across different types of roads. This, in essence, will aid you in making more informed decisions related to routing, scheduling, and resource planning in your business operations.
Example of Major Roads with Median Speed
The table below provides insights into the median speeds of vehicular commutes across various roadways in the United Kingdom. Each row signifies a distinct segment, representing a specific roadway. The streetName column details the name of these road segments, ranging from local roads such as 'Saint Albans Road' and 'Gallows Corner Roundabout', to major motorways including 'A1(M)' and 'M40'.
Similarly, the medianSpeed column is associated with each road, representing the median speed of vehicles on these segments, expressed in miles per hour. The values vary widely, indicating different speeds vehicles maintain, owing to various factors like road conditions, traffic rules, and vehicle types.
Together, these data points help in understanding the typical pace of traffic across diverse roads, providing a comprehensive outlook of the overall road traffic scenario in the UK.
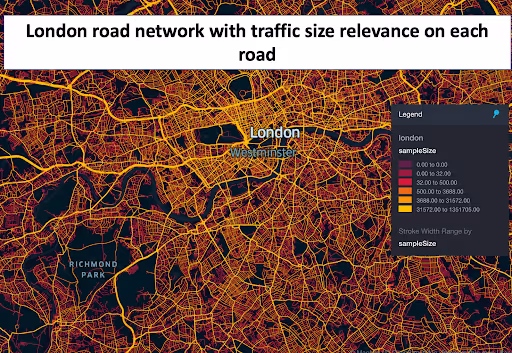
London Road Network with Traffic Size Relevance on Each Road
In this exploration, we dive deep into the structure of London's highway network, shedding light on the traffic volume across various roads. This offers a comprehensive understanding of how traffic is dispersed throughout the city, pointing out main roads that witness high traffic and areas prone to gridlock.
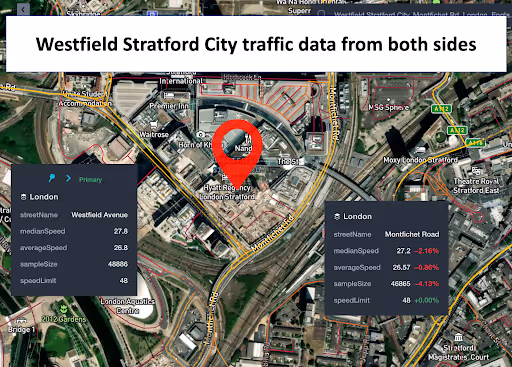
Westfield Stratford City Traffic Data
Zeroing in on the vicinity of Westfield Stratford City, this data analysis shines a light on the traffic volume and congestion from both directions leading to the shopping complex. This is quintessential for grasping the dynamics of traffic that stem from retail and recreational activities within this bustling neighborhood.
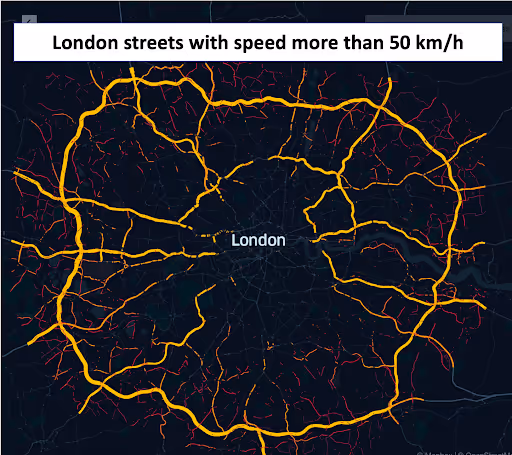
London Streets with Speed More Than 50km/h
We delve into London traffic data, spotlighting those areas where vehicles typically exceed speeds of 50km/h. This focus could prove instrumental in evaluating road safety measures and informing decisions regarding urban development.
Use cases of UK's Road Traffic Data
Now, let's take a look at how you can apply this valuable information to your advantage. Whether you're managing a large corporation, a small enterprise, or even a startup, the utility of UK's road traffic data cannot be underestimated.
Strategic Business Location
For retail businesses and commercial establishments, this data could be instrumental in choosing the best location. Proximity to areas with high traffic flow and density might mean a higher possibility of footfall.
Real Estate Investment
Real estate investors can make use of the data as well. For instance, properties near peak traffic zones might hold potential for higher returns on investment. Conversely, those seeking quieter residential neighborhoods might want to avoid these areas.
Optimizing Logistics
For businesses in the delivery services, logistics, and transportation sectors, analyzing traffic density and commuting patterns is key to refining route optimization strategies. By leveraging this data, companies can improve fleet efficiency, shorten delivery times, and ultimately boost customer satisfaction through timely and reliable service.
Informed Infrastructure Development
This exhaustive data could also prove beneficial for infrastructure development companies. Knowing where the traffic is heaviest can inform decisions about where to invest in new roads or road expansions.
Public Transportation Planning
If you're part of a local government or a municipality, this data can aid in structuring efficient public transportation strategies. Evaluating current density and flow of traffic, as well as commute patterns, can provide insight into where new bus routes or subway stations might be most needed.
Conclusion
In sum, understanding the UK's road traffic data can empower your business to make informed strategic decisions, optimize logistics, invest wisely in real estate, plan efficient public transportation services, and develop infrastructure cognizantly. Utilizing this data can provide magnified insights into traffic flow, density, commuting patterns, and peak hours, thus giving you a competitive edge in the market. For a comparative perspective, businesses can also explore how other regions manage mobility—such as in this detailed breakdown of road traffic patterns in the United Arab Emirates (UAE), which offers valuable insights into transport dynamics across rapidly evolving urban networks.
How xMap can help businesses comprehend UK Road Traffic Data
- Visualisation Tools: xMap presents complex data in an easy-to-understand visual format, making it easier for businesses to draw conclusions and formulate plans.
- Detailed Information: xMap provides in-depth information on various vital parameters, including traffic flow, density, and peak hours.
- Updated Data: With the continual flow of updated data, xMap ensures businesses have the most recent and reliable information at hand.
- Data Analysis: xMap offers advanced data analysis tools, enabling businesses to predict traffic patterns and plan accordingly.
- User-friendly Interface: xMap’s intuitive interface allows all stakeholders to interact with the data easily, fostering better decision-making.
To get all the details about United Kingdom Traffic data, See this dataset page.
Or visit our catalog page.
If you’d like to data samples for other countries like Egypt, USA, Switzerland, Japan, Turkey, UAE, and others, please visit our platform and sign up.
This data is provided by LocationMind but the data source is TomTom

Subscribe for advanced Data analysis Tips and Reports

Get in Touch
Whatever your goal or project size, we will handle it.
We will ensure you 100% satisfication.
"We focus on delivering quality data tailored to businesses needs from all around the world. Whether you are a restaurant, a hotel, or even a gym, you can empower your operations' decisions with geo-data.”

