Data Analysis Guide: Comprehensive Insights for Research Analysts

- Remove the current class from the content27_link item as Webflows native current state will automatically be applied.
- To add interactions which automatically expand and collapse sections in the table of contents, select the content27_h-trigger element, add an element trigger, and select Mouse click (tap).
- For the 1st click, select the custom animation Content 27 table of contents [Expand], and for the 2nd click, select the custom animation Content 27 table of contents [Collapse].
- In the Trigger Settings, deselect all checkboxes other than Desktop and above. This disables the interaction on tablet and below to prevent bugs when scrolling.
Welcome to the world of data analysis! This transformative practice, when unleashed in its full potential, can serve as the backbone of your strategic decisions and guide your enterprise on a path toward market leadership. The real power of data analysis emerges when we translate raw and unstructured data into robust, actionable insights that can inform every facet of your business strategy.
But before you get to that point, it's crucial to understand the core concepts of data analysis. On that note, let's delve into the process, types, methods, and techniques that constitute the realm of data analysis.
What is Data Analysis?
When we talk about data analysis, what exactly are we referring to? At its core, data analysis is a systematic process that involves inspecting, cleaning, transforming, and modeling data. We do this to discover useful insights, suggest conclusions, and support decision-making.
Data analysis is a valuable tool for businesses, helping strategic decision making based on accurate information rather than guesswork. It allows companies to identify trends swiftly, providing a competitive advantage.
Understanding the Data Analysis Process
When you delve into the process of data analysis, it’s like embarking on a journey, one that can lead to profound insights and transformative decisions. Understanding this process allows you not only to comprehend the complexity of the journey but also to maximize the power of your collected data. Let's break down the journey, step by step.
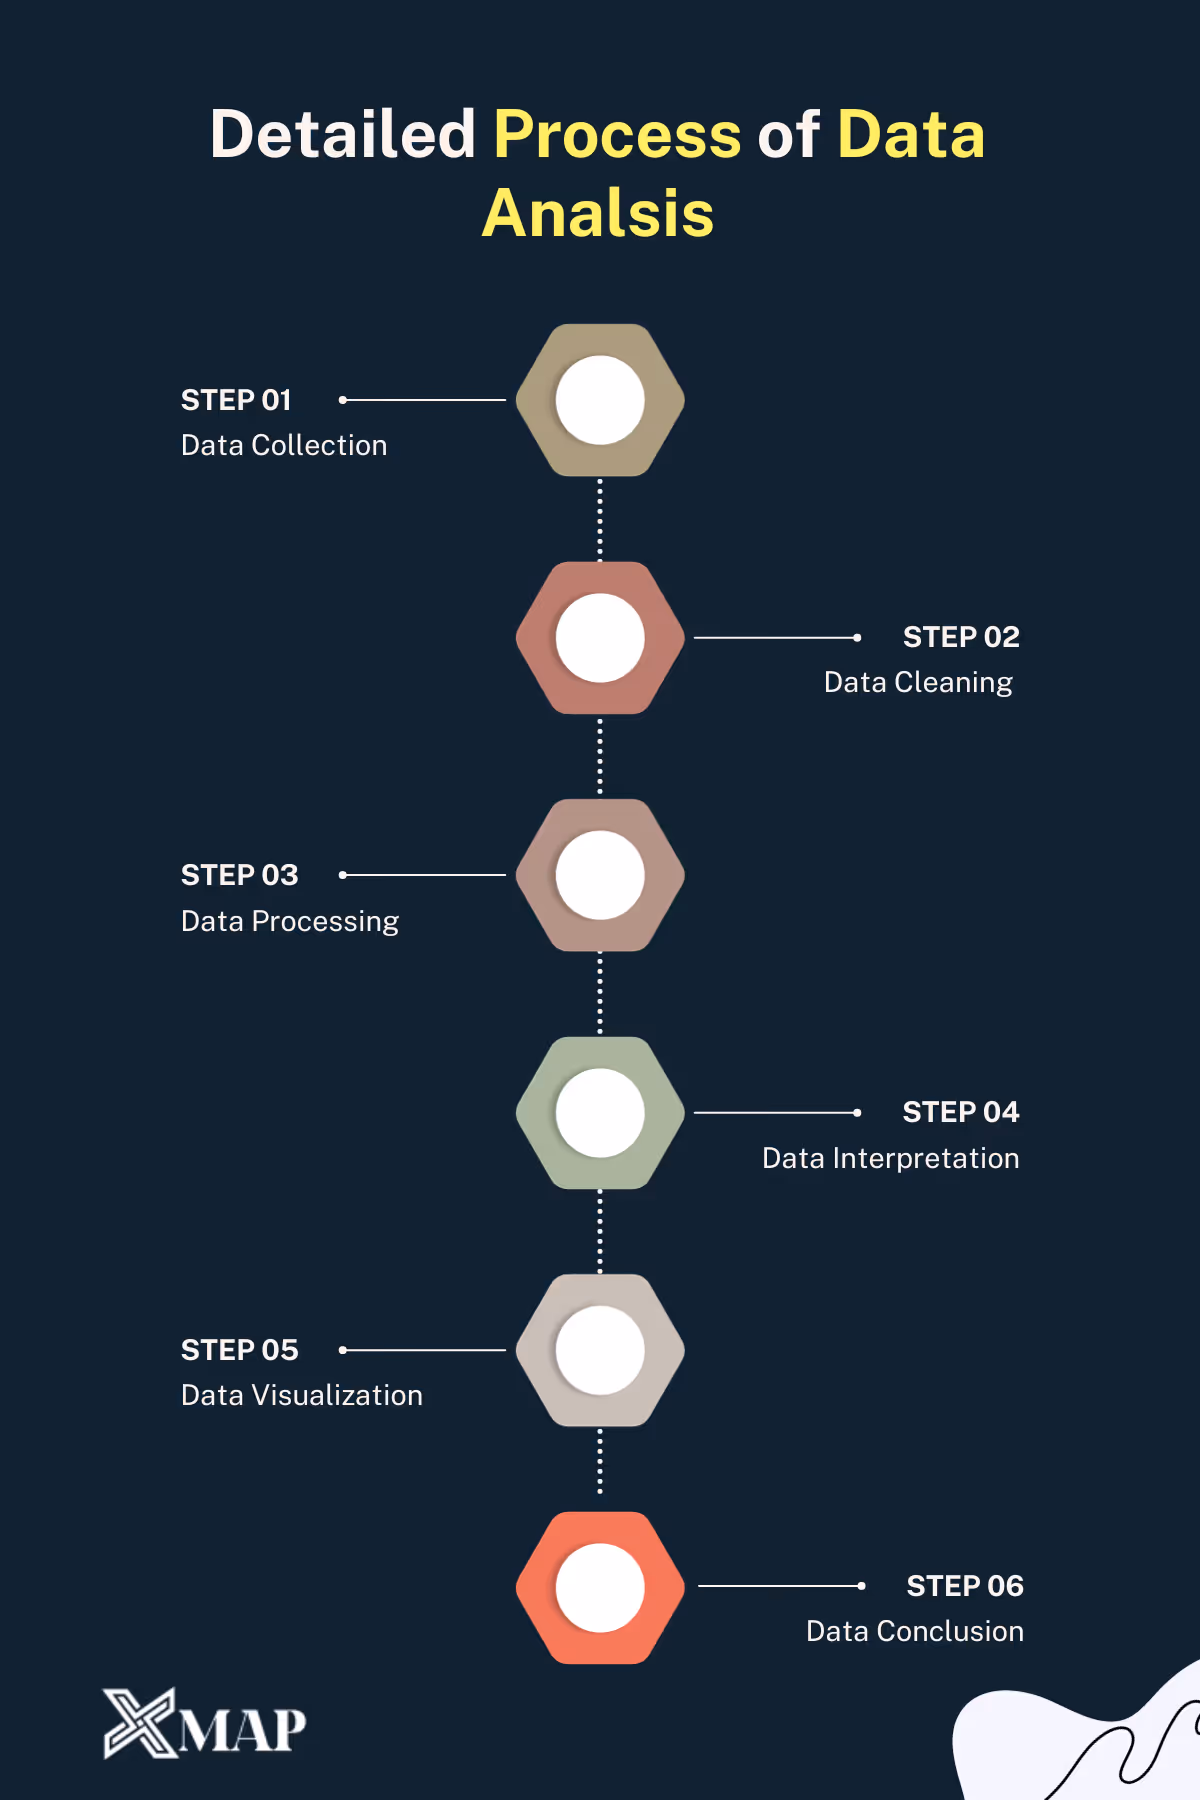
Step 1: Data Collection
Your data analysis journey begins with collecting relevant data. This act is more than just gathering information – it’s about obtaining strategic, high-quality data that pertains to your specific research or business question. This data can be collected via multiple channels such as surveys, interviews, or digital tools like xMap.
Step 2: Data Cleaning
After collecting the data, the next step involves cleaning it. This step is essential because real-world data can often be messy and unorganized. Cleaning data involves dealing with inconsistencies, errors, outliers, or even missing values, ensuring that your data is ready for thorough examination.
Step 3: Data Processing
Processing your data involves organizing it in a way that aids analysis. This may mean structuring an unstructured data set or converting it into a format that can be easily worked with, such as into tables or diagrams for visual representation.
Step 4: Data Interpretation
This is the part where the magic begins to happen! In data interpretation, you utilize statistical methods to decipher trends, patterns, or themes from your processed data. By carefully reviewing this information, you can start to paint a picture of what the data is telling you.
Step 5: Data Visualization
It’s one thing to interpret the data, but another to be able to communicate those interpretations effectively. Data visualization tools help bring your findings to life, using graphs, charts, or infographics. This step makes it easier for non-technical stakeholders to understand your findings.
Step 6: Data Conclusion
Last but certainly not least, you arrive at the final step - making conclusions from your data. By drawing from your insights in the interpretation and visualization stages, you can make informed judgments and actionable decisions that can fuel business strategies.
Exploring Different Types of Data Analysis
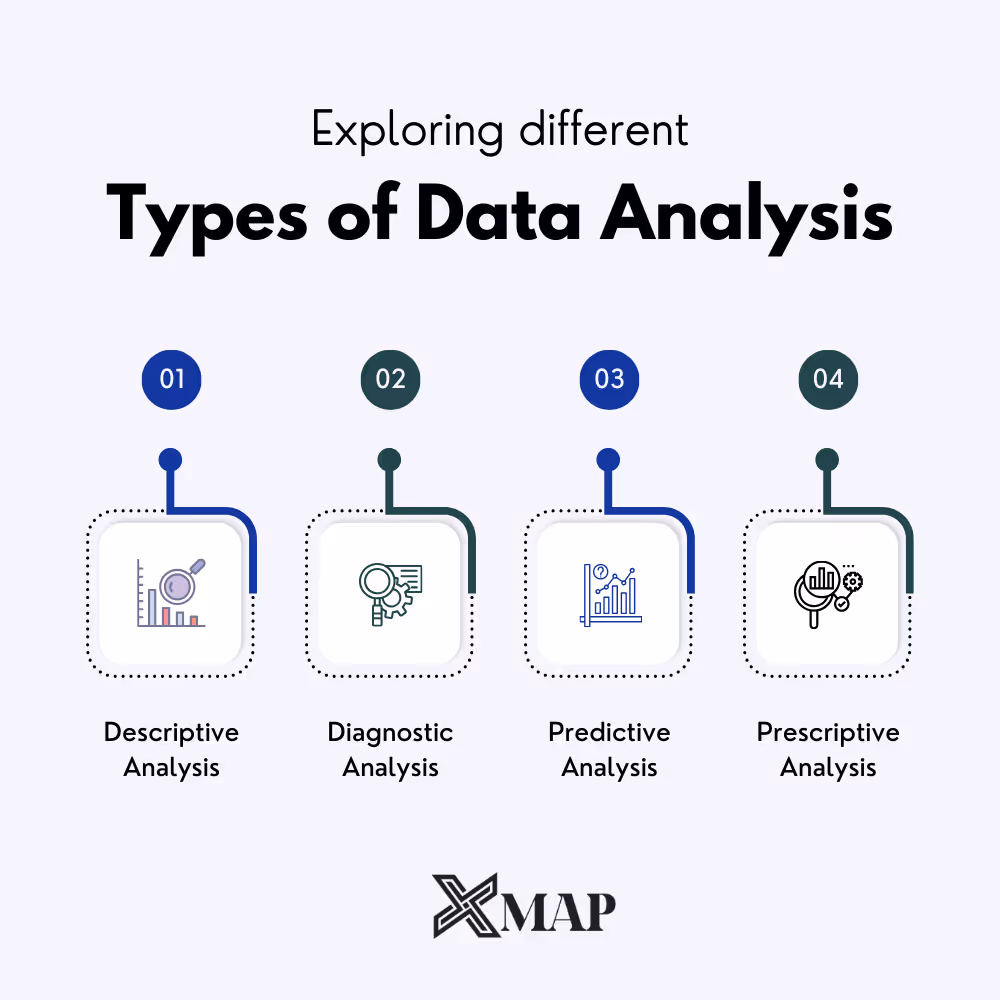
As you delve more deeply into data analysis, you'll encounter a fascinating variety of approaches, each with its unique potentials. While they all share the unifying goal of extracting knowledge from data, they differ according to the nature of the data involved, the objectives of the analysis, and the specific techniques employed. Let's jump in and uncover this diversity!
Descriptive Analysis
Ever wondered about the current state of your business or project? Descriptive analysis answers that question for you. It uses data aggregation and mining tools to provide insight into the past. This form of data analysis is vital in identifying patterns and making data-driven decisions based on past behaviors. Think of it as using a rear-view mirror to examine your past journey and plan better for future drives.
Diagnostic Analysis
Imagine you've identified a problem or an unexpected event. You are left with the pressing question, 'why did this happen?'. Here's where diagnostic analysis steps in, peeling back the layers to uncover the root cause. By scrutinizing various data sets and focusing on detailed content, this type of analysis eliminates guesswork and pinpoints the cause and effect within your data.
Predictive Analysis
What if you had the power to predict the future? Predictive analysis moves a step ahead and uses statistical models and forecasting techniques to understand the future. While it doesn’t guarantee absolute accuracy, it's an unparalleled asset in trend assessment and strategic planning. This can be particularly helpful for forecasting sales, budgeting efforts, or even predicting market trends.
Prescriptive Analysis
As the most advanced type of data analysis, prescriptive analysis proposes solutions by utilizing state-of-the-art technology such as machine learning and algorithms. It goes beyond predicting future outcomes by suggesting action plans to take advantage of the predicted scenario. It’s like having a smart navigation system that not only predicts traffic but also suggests the best routes in real-time.
Methods and Techniques for Effective Data Analysis
If you're aspiring to leverage data analysis to its fullest extent, you need to acquaint yourself with the different methods and techniques for effective data analysis. Each method or technique has its specific use and advantages, and you should choose one based on your business needs and goals.
Quantitative and Qualitative Methods
There are two broad categories when it comes to data analysis methods: Quantitative and Qualitative. Quantitative methods are typically used when dealing with numerical data. It allows you to gather statistical evidence and tends to be more structured. Qualitative methods, on the other hand, deal with non-numerical data. With this, you can understand underlying reasons, opinions, and motivations, providing a depth of insights.
Regression Analysis
An essential technique on your data analysis toolbox should be Regression Analysis. Regression Analysis helps in identifying and analyzing the relationship between different variables. You can determine how one variable changes will affect the others. This technique is often used in forecasting and modeling scenarios.
Factor Analysis
Factor Analysis is a technique used to understand the structure of the relationship between variables. It allows you to identify underlying factors that explain why data is behaving a certain way. For instance, consider market trends and customer preferences, which may be affected by any number of unseen factors such as economic conditions or competitor actions.
Time Series Analysis
When working with data captured at different periods, Time Series Analysis is a beneficial technique. It helps you identify patterns and predict future trends based on historical data. This method is especially useful for forecasting sales, budget planning, stock market analysis, and more.
Neural Networking
In the contemporary data-driven world, Neural Networks are profoundly changing how companies analyze data. Neural Networks, a subset of artificial intelligence, is a technique that mimics the human brain in processing data and creating patterns for decision making. It's particularly useful in complex problem-solving scenarios where deep learning is required.
How xMap can help you in Data Analysis?
Accessing and analyzing data has become simpler and more effective with the advent of platforms like xMap. As a strategic research analyst, you can use this powerful tool to streamline, optimize, and enhance your data analysis projects. Here's how:
- Data Accessibility and Integration: With xMap, you can easily access and integrate different types and forms of data from multiple sources. Whether it's demographic data, consumer behavior data, social media data, or geospatial data, xMap transforms them into an easy-to-analyze format.
- Location Intelligence: xMap excels at generating geocentric data insights, helping you visualize and interpret data in the context of location. This added geographical perspective can lead to more nuanced and relevant insights, especially for market analysis and expansion planning.
- Data Visualization: Part of data analysis is communicating the conclusions drawn, and that's where xMap's data visualization capabilities come to the fore. From comprehensive map views to detailed plotting, this feature lets you present your analysis in a digestible and engaging format.
Essentially, with the support of xMap, you're not just analyzing data but unlocking valuable opportunities hidden within. Embrace this transformation, and you'll be able to deliver actionable insights that can drive strategic decision-making for your enterprise.
Subscribe for advanced Data analysis Tips and Reports

Get in Touch
Whatever your goal or project size, we will handle it.
We will ensure you 100% satisfication.
"We focus on delivering quality data tailored to businesses needs from all around the world. Whether you are a restaurant, a hotel, or even a gym, you can empower your operations' decisions with geo-data.”

