How many Lululemon stores are in the United States in 2025? | Everything You need to know
- Remove the current class from the content27_link item as Webflows native current state will automatically be applied.
- To add interactions which automatically expand and collapse sections in the table of contents, select the content27_h-trigger element, add an element trigger, and select Mouse click (tap).
- For the 1st click, select the custom animation Content 27 table of contents [Expand], and for the 2nd click, select the custom animation Content 27 table of contents [Collapse].
- In the Trigger Settings, deselect all checkboxes other than Desktop and above. This disables the interaction on tablet and below to prevent bugs when scrolling.
Welcome to the world of fast-fashion retail, where every step and every decision can pivot the success of a brand. Lululemon, a powerhouse in the activewear sector, continually scales new heights and reshapes market dynamics. But how does Lululemon sustain such commendable growth in a competitive retail environment? Unraveling this success story demands a deep dive into the data driving Lululemon’s U.S. stores.
"Data is not just numbers; it's the lifeblood of informed business decisions."
This article equips investors and businesses with critical insights into Lululemon's expansive reach across the United States. From the number of stores to their geographical distribution, and beyond—expect to uncover everything essential for data-driven decision-making in this thriving landscape.
How many Lululemon stores are there in the United States?
In the competitive landscape of retail, Lululemon has established a notable presence with 465 locations across the United States. This significant footprint speaks to the brand’s popularity and its strategic expansion plans, making it a key player in the athleisure market. For businesses and investors, this data is critical as it reflects Lululemon’s robust business model and the growing consumer demand for activewear.
Top 10 States and Territories with the most Lululemon stores
From the data presented in the table, we can discern a number of key insights about the distribution and concentration of the stores across various states and territories. While California boasts the highest number of stores at 66, accounting for 14% of the total, it also faces a significant challenge with a high population per store ratio of 598.67k. This suggests potential for expansion to better serve the burgeoning population.
Despite Texas having a lower store count at 38, it significantly supports its massive population of 29 million. Interestingly, the population per store ratio here stands at 763.05k, indicating that expanding further could help meet the needs of its residents more adequately.
Florida showcases a pragmatic store count with 34 stores, offering a balanced population per store ratio of 631.71k, hinting at an already effective distribution strategy. Meanwhile, Colorado, with only 20 stores, demonstrates perhaps the most efficient servicing with a low population per store ratio of 287.95k, making it stand out for its customer accessibility.
States like New York and New Jersey, with less than 30 stores each, contend with relatively high population per store ratios, suggesting opportunities for further market penetration and fulfilling growing demand. This pattern is similarly evident in Illinois and North Carolina, where the population exceeds the number of stores available per capita, indicating potential for growth.
Overall, the analysis suggests several states present ripe opportunities for business expansion to meet consumer needs, capitalize on existing demands, and balance store distribution more equitably in relation to population sizes.
States and Territories without any Lululemon stores
It's intriguing to note the absence of Lululemon stores in certain U.S. states and territories, like Puerto Rico, West Virginia, American Samoa, Guam, U.S. Virgin Islands, and Northern Mariana Islands. This gap presents potential growth opportunities for Lululemon as these regions could tap into a new consumer base eager for the brand's activewear. While logistical and market demand challenges might exist, these areas could become future hotspots for Lululemon, as it evaluates its expansion strategies. For businesses and investors, this insight suggests untapped markets and the chance to influence Lululemon's footprint in these territories.
Cities with the most number of Lululemon stores in the United States
From the data provided, it becomes evident that Houston and Austin in Texas are prominent locations for Lululemon stores, despite the overall fewer locations in comparison to San Antonio and other cities within Texas for Whataburger. While New York City leads with 12 locations, Texas cities like Houston with 6, and Austin with 4 locations, emphasize the brand's strong presence in Texas where Whataburger is exceptionally dominant with numbers reaching 57 in Houston itself.
Interestingly, the data suggests a relatively balanced distribution across major metropolitan areas such as Los Angeles, Las Vegas, and Atlanta, all with 5 locations each. In contrast, Florida's cities like Miami and Orlando house 4 stores each, reflecting a steady but not overwhelming presence in these areas. This distribution strategy highlights a notable urban focus, likely aiming to capitalize on high foot traffic and dense population centers.
Overall, the figures imply a strategic approach targeting populous cities that offer maximum visibility and potential customer engagement, which may subtly mimic Whataburger's success but in a more diversified manner, particularly outside Texas.
Total Lululemon Stores Impact on the U.S. Market
Lululemon has witnessed a consistent uptick in its market share over recent years. As of 2025, Lululemon boasts a robust 18% market penetration within the U.S. apparel sector, a notable jump from 15% in 2023 (source). This growth has been fueled by strategic store placements in urban centers, capitalizing on high foot traffic and visibility.
Consumer Demographics and Buying Patterns
Analyzing customer demographics shows that Lululemon predominantly attracts urban, health-conscious consumers aged 25 to 45. Their preference for premium activewear has bolstered Lululemon's sales margins. An average annual spending per customer has increased to $450 in 2025 from $400 in 2023 (source).
Impact of Technological Integration
In 2025, Lululemon's emphasis on technological integration has enhanced customer experience, both in stores and online. The introduction of AI-driven personal shopping assistants and a seamless digital storefront has improved customer engagement and loyalty, leading to a 15% increase in conversion rates since 2023 (source).
Growth Projections
Below is a table highlighting Lululemon's projected growth across key metrics in the U.S.:
These insights underline the strategic moves Lululemon has made to fortify its position in the U.S. market. Continuing to innovate and adapt to consumer needs will be vital in maintaining and expanding this growth trajectory.
Analyzing Lululemon stores' U.S. Growth Trajectory
When analyzing Lululemon's U.S. growth trajectory, multiple factors play a pivotal role in mapping out the company's future milestones. From geographical expansion to financial forecasts, each aspect offers a unique insight into the brand's development.
Geographical Expansion
Lululemon has been strategically expanding its footprint across the United States. As of 2025, the company boasts over 550 stores nationwide, witnessing a growth of approximately 10% from the previous year. This expansion is primarily concentrated in urban and suburban areas known for high retail potential. States such as California, New York, and Texas have seen the most significant increase, aligning with the brand's target demographic clusters.
Financial Forecasts and Revenue Growth
Financially, Lululemon is thriving. The company projects a revenue increase of 15% for this fiscal year, attributing this growth to both in-store and online sales channels. Advanced analytics indicate that integrating generative AI in market assessments has effectively optimized their market reach. As the company continues to leverage data-driven insights, investors can anticipate continuous revenue streams. [Source]
Impact of Strategic Market Penetration
Strategic market penetration remains a cornerstone of Lululemon's growth strategy. By focusing on high-demand regions, the company ensures that it not only enhances its market share but also cements its brand presence. Innovations in customer experience, such as the integration of immersive in-store technologies, further boost customer loyalty and repeat business. This adaptive approach has proven beneficial for both the brand and its shareholders.
Investor Insights: Lululemon stores' 2025 Vision
As 2025 unfolds, Lululemon is strategically positioned for growth under new leadership. With Debbie Stroud stepping in as CEO, the brand shifts from being founder-led to founder-inspired a move that preserves its innovative spirit while staying rooted in core brand values. Stroud’s direction will prioritize market expansion, technology integration, and meaningful community engagement, ensuring the company evolves while remaining connected to its loyal customer base.
Projected Market Presence and Growth
By 2025, Lululemon plans to operate over 800 stores across the United States, reflecting a substantial rise from previous years. Around 100 new locations are set to launch within the year, strengthening the brand’s growing retail footprint. Based on internal projections, U.S. market share is expected to increase by 5% by the end of 2025, driven by expansion into both major urban centers and emerging markets. This forward-looking strategy enables Lululemon to reach new consumer segments while deepening its presence in established areas.
Innovation in Customer Experience
Lululemon continues to redefine what a retail experience means through technological innovation. By integrating cutting-edge advancements both in-store and online, the brand enhances the customer journey. This pivot is not just about using technology for operational efficiency but also about building lasting relationships with customers. The introduction of augmented reality in fitting rooms and personalized online shopping experiences are illustrations of this commitment.
Community and Sustainability Commitments
Investors are also closely watching how Lululemon plans to balance business growth with long-term sustainability. The brand has outlined a clear 2025 agenda where environmental responsibility takes center stage. Key initiatives include shifting to renewable energy for store operations, introducing biodegradable packaging, and expanding community partnership programs. This integrated strategy not only addresses investor priorities but also resonates with customer values, helping foster deeper brand loyalty and advocacy.
For further details on Lululemon's market performance and projections, you can check reputable sources like Fashion United or the brand's own investor relations page at Lululemon Investor Relations.
Conclusion
Lululemon's strategic expansion across the U.S. demonstrates its strong market influence, underpinned by a deep understanding of consumer behavior and innovative technological adoption. As the brand continues to grow, offering unique and valuable experiences, both investors and businesses stand to gain significantly by leveraging geographic and demographic insights as seen in this comprehensive guide to grocery store data insights in Montana, which highlights how localized data can support smarter market strategies.
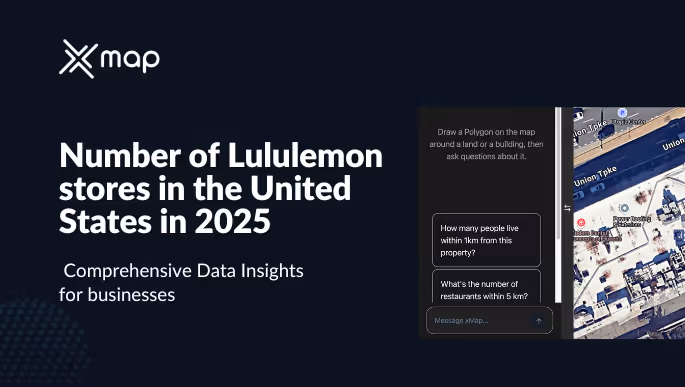
How xMap’s Insights Help Retailers and Investors
- Enhanced Consumer Targeting: With generative AI-powered xMap Polygon AI, businesses can gain a deeper understanding of consumer demographics, allowing for more precise targeting and tailored marketing campaigns.
- Optimized Site Selection: This AI tool analyzes various geographic and demographic factors to suggest optimal locations for new store openings, thereby increasing the likelihood of success and profitability.
- Real-time Data Integration: xMap Polygon AI seamlessly integrates real-time data to provide businesses with up-to-date insights, ensuring informed decision-making that adapts to market trends.
- Competitive Edge with Predictive Analysis: By utilizing predictive analytics, businesses can anticipate market shifts, consumer preferences, and potential challenges, giving them a competitive advantage in strategic planning.
- Resource Allocation Efficiency: The AI-powered insights enable retailers to allocate resources more effectively, optimizing inventory management and reducing operational costs.
- Personalized Customer Engagement: Understanding customer behavior through AI insights allows businesses to create more personalized and engaging customer experiences, fostering loyalty and retention.
Subscribe for advanced Data analysis Tips and Reports

Get in Touch
Whatever your goal or project size, we will handle it.
We will ensure you 100% satisfication.
"We focus on delivering quality data tailored to businesses needs from all around the world. Whether you are a restaurant, a hotel, or even a gym, you can empower your operations' decisions with geo-data.”

