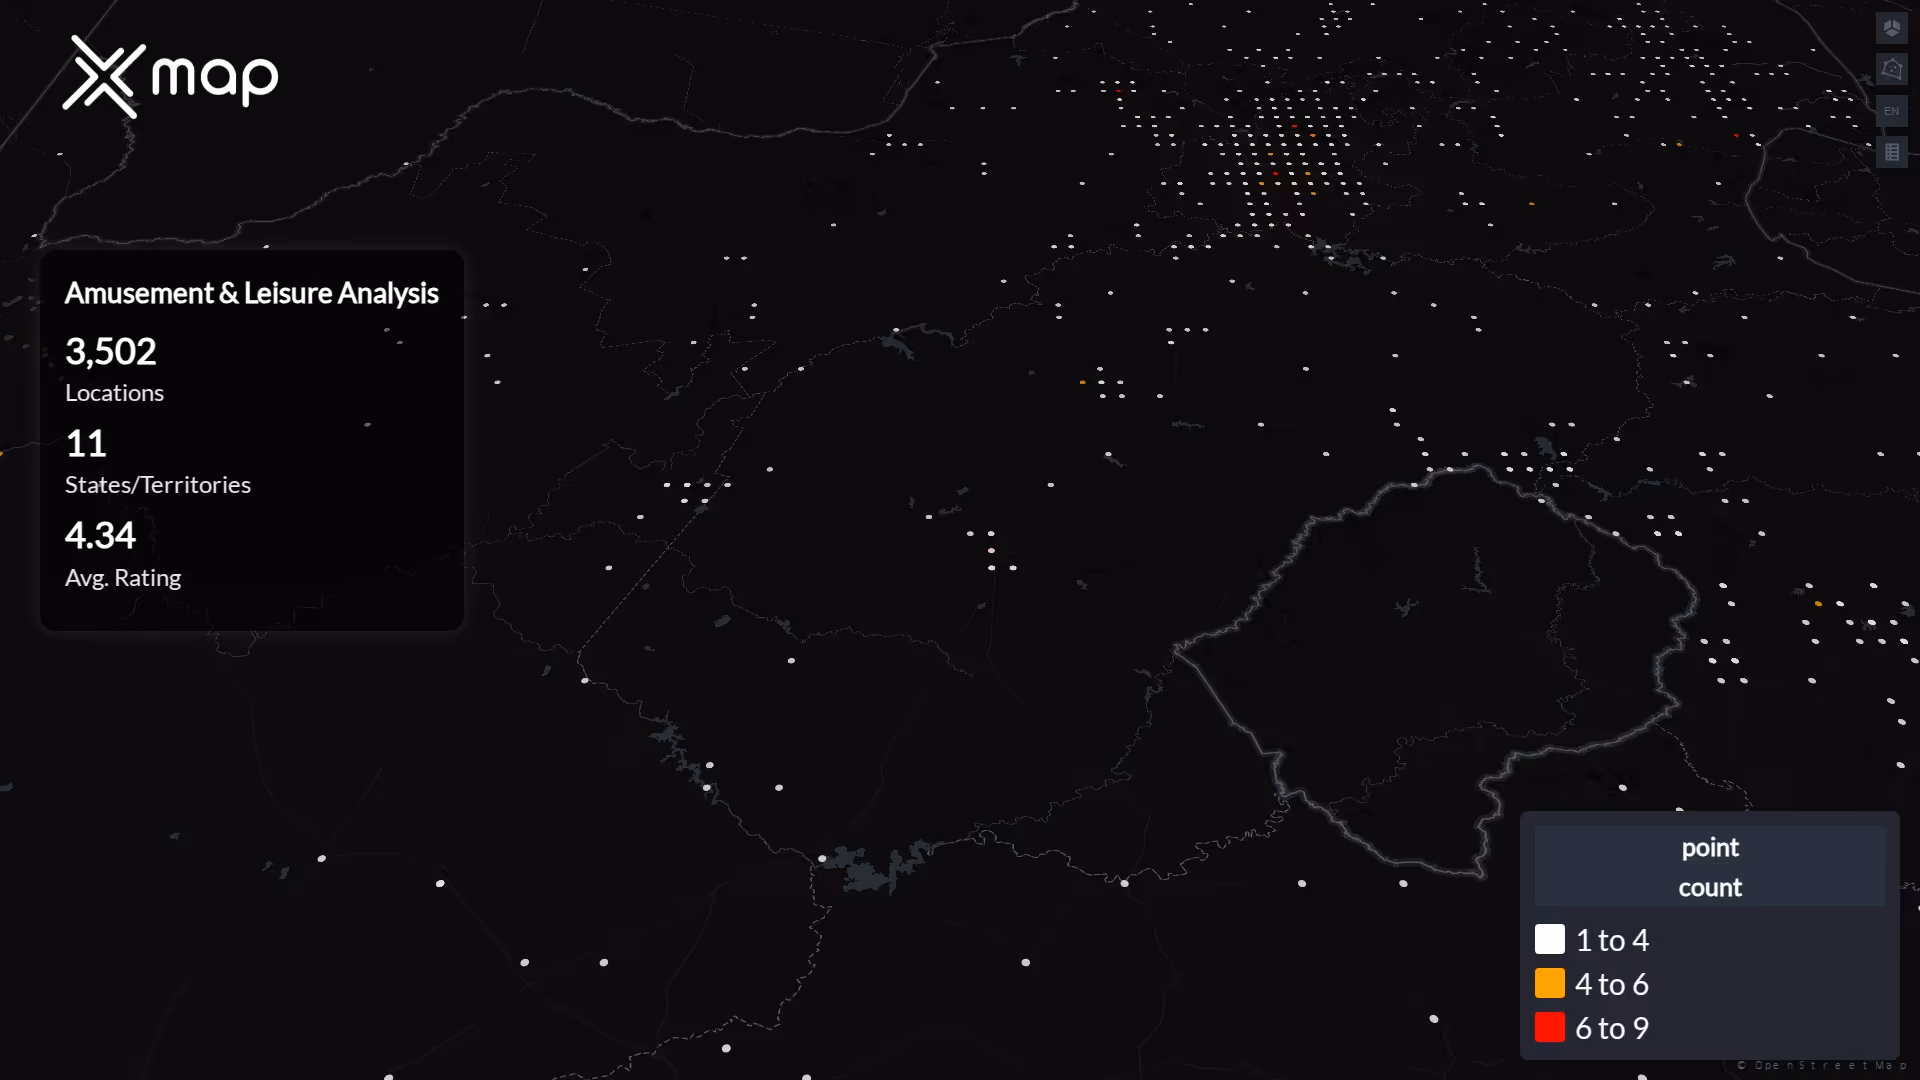
Amusement & Leisure Locations Across South Africa

With over 3,502+ Amusement & Leisure locations across 11 regions and 54 districts in South Africa. The highest number of Amusement & Leisure locations are in Western Cape and City of Cape Town with 936 locations and 432 locations, respectively. Find the best places for Amusement & leisure with our updated database.

Aggregation Date :
March 19, 2025

How Many Amusement & Leisure Establishments are in South Africa?

South Africa has 3,577 Amusement & Leisure locations, with a strong presence across various regions. Our dataset provides insights into their business status, ratings, and traffic scores.

3502

Number of Locations

2693

Locations with Ratings

2327

Locations with Phone Numbers

1382

Locations with Websites

456

Closed Locations

Breakdown of Amusement & Leisure Locations in South africa

South africa's Amusement & Leisure scene includes various subcategories. Explore the most popular categories and find the best spots across the country.

Category

Number of Locations

Misc. Leisure Activities

2,346

Amusement Parks & Arcades

394

Movie Theaters

285

Bowling & Billiards

230

Aquariums & Zoos

120

Mini Golf & Go-Karts

100

Escape Rooms & Similar

27

Amusement & leisure Locations by State in South Africa

South africa's Amusement & leisure scene varies across states, with hotspots in major metropolitan areas like Western Cape, Gauteng, KwaZulu-Natal. Explore the number of locations by state.
State
Number of Locations
Western Cape936
Gauteng868
KwaZulu-Natal579
Eastern Cape315
Limpopo240
Mpumalanga215
North West168
Free State113
Northern Cape66
Central1

Top Cities for Amusement & leisure in South africa

South africa's Amusement & leisure hotspots are concentrated in major cities like City of Cape Town, City of Johannesburg, City of Tshwane. Discover the top locations where Amusement & leisure establishments thrive.
CityState
Number of Locations
City of Cape Town Western Cape 432
City of Johannesburg Gauteng 360
City of Tshwane Gauteng 278
eThekwini KwaZulu-Natal 267
Eden Western Cape 221
Ehlanzeni Mpumalanga 141
Ekurhuleni Gauteng 136
Cape Winelands Western Cape 135
Bojanala North West 123
Cacadu Eastern Cape 108

Download a Sample Dataset for Amusement & leisure Locations in South africa.

Get a preview of South Africa's Amusement & Leisure dataset, including business status, ratings, traffic scores, and more.

Key Variables for Amusement & Leisure Dataset in South Africa

This dataset contains essential details about Amusement & Leisure locations, including business information, traffic insights, and contact details.
NameDescriptionData Type
namePrimary name of the locationObject
country_nameFull country nameObject
regionCurrent administrative regionObject
localityCurrent locality or cityObject
postcodePostal codeFloat
streetStreet addressObject
addressFull addressObject
phonePrimary contact numberObject
longitudeLongitude coordinateFloat
latitudeLatitude coordinateFloat
business_statusCurrent business status (e.g., Open, Closed)Object
category_mainPrimary business categoryObject
website_domainWebsite domain nameObject
time_spentSuggested duration of visitObject

Business Closure Insights for Amusement & Leisure in South Africa

This dataset tracks open, temporarily closed, and permanently closed dining locations across South Africa, helping businesses assess market stability.
State & Territory
Number of Closed Locations
Gauteng131 (28.7%)
Western Cape117 (25.7%)
KwaZulu-Natal73 (16.0%)
Eastern Cape35 (7.7%)
Mpumalanga31 (6.8%)
Free State24 (5.3%)
North West18 (3.9%)
Limpopo18 (3.9%)
Northern Cape8 (1.8%)
Central1 (0.2%)

Traffic Insights for Amusement & Leisure Locations in South Africa

Understand which cities and locations attract the most visitors using traffic scores. This data helps businesses choose prime locations for expansion.
State & TerritoryTraffic Score
Gauteng37.4
Mpumalanga37.3
Western Cape37.2
KwaZulu-Natal37.1
Eastern Cape34.6
North West33.5
Free State32.8
Limpopo32.7
Northern Cape31.0

Customer Ratings for Amusement & Leisure Locations in South Africa

This dataset includes average customer ratings along with the number of ratings for each region, helping businesses identify top-rated places and customer preferences across different cities.
State & Territory Ratings Count
Average Ratings
Maputo 1 5.0
Western Cape 730 4.5
Eastern Cape 266 4.4
Mpumalanga 163 4.3
KwaZulu-Natal 464 4.3
Gauteng 626 4.3
Free State 85 4.2
Limpopo 176 4.2
North West 134 4.2
Northern Cape 48 4.2

Business Contact Information by States for Amusement & Leisure dataset in South Africa

Many locations provide direct contact details, including phone numbers and websites, making it easier for businesses to engage with partners and customers.
State & Territory Number of Locations with Websites
Number of Locations with Phone Numbers
Western Cape 407 (32.4%) 407 (32.4%)
Gauteng 324 (25.8%) 324 (25.8%)
KwaZulu-Natal 193 (15.3%) 193 (15.3%)
Eastern Cape 103 (8.2%) 103 (8.2%)
Limpopo 67 (5.3%) 67 (5.3%)
Mpumalanga 59 (4.7%) 59 (4.7%)
North West 58 (4.6%) 58 (4.6%)
Free State 32 (2.5%) 32 (2.5%)
Northern Cape 15 (1.2%) 15 (1.2%)

Why Businesses Trust xMap's Amusement & Leisure Locations Dataset for South Africa?

Businesses rely on xMap's dataset because it provides:

  • Comprehensive Coverage – Over 3,577 verified Amusement & Leisure locations across South Africa.
  • Real-Time Insights – Updated business status, ratings, traffic scores, and consumer trends.
  • High Data Accuracy – Curated from reliable sources with precise geolocation details.
  • Business-Friendly Format – Easy-to-use data for market analysis, site selection, and competitor research.
  • Proven Value – Trusted by retailers, real estate developers, and urban planners for strategic decision-making.

Use Cases

How can this dataset benefit you?

Site Selection & Market Expansion

Businesses can identify high-traffic locations to expand their operations in South Africa based on footfall trends and business status.

Competitive & Consumer Insights

Analyze top-rated establishments, brand distribution, and category trends to understand market dynamics and customer preferences.

Real Estate & Urban Planning

City planners and real estate developers can use traffic data and closure rates to assess demand and optimize zoning for commercial spaces.

Get Access to South africa's Amusement & leisure Data Today!

Enhance your business strategy, site selection, and market research with real-time insights on over 3,502+ Amusement & leisure locations across South africa. Download the dataset now and stay ahead of the competition!

よくあるご質問

空間分析プラットフォームに関するよくある質問への回答をご覧ください。

どのくらいの頻度でデータを更新しますか?

月に一度

無料サンプルを入手できますか?

はい、データを購入する前に無料サンプルを提供しています。

xMap はデータ統合をサポートしていますか?

はい。当社のチームは、既存のデータベースまたはウェアハウスへのデータ統合をサポートします。

データを信頼するにはどうすればいいですか?

データに関するすべての指標を含むデータ評価シートが届きます。xMapチームはデータサイエンスのバックグラウンドを持ち、データ品質が最優先事項です

データにはどのようなドキュメントが含まれていますか?

次の3つのものをお届けします。
1。データファイル
2。データアセスメント
3。すべての列を説明するシートデータドキュメント

データアナリストがいませんが、データを分析してもらえますか?

はい、お客様に代ってデータを分析し、インサイトを直接共有できます

xMap データを機械学習モデリングに使用できますか?

はい。当社のデータは、小売、販売、マーケティングなどの機械学習モデリングに使用できます。データの使用方法について無料で相談できます。

データの更新はどのように入手できますか?

Google クラウドストレージや AWS S3 などのクラウドサービスを通じてデータの更新を受け取ります。

私たちのチームはデータを購入したいと思っていますが、法務チームはデータの収集方法に関する情報を求めています。そのような情報を提供してもらえますか?

はい、私たちは以前にこのような複数のケースを処理しました。

データを集約する必要がありますが、データを集計できますか?

データをお客様の好みの形に加工することができます。