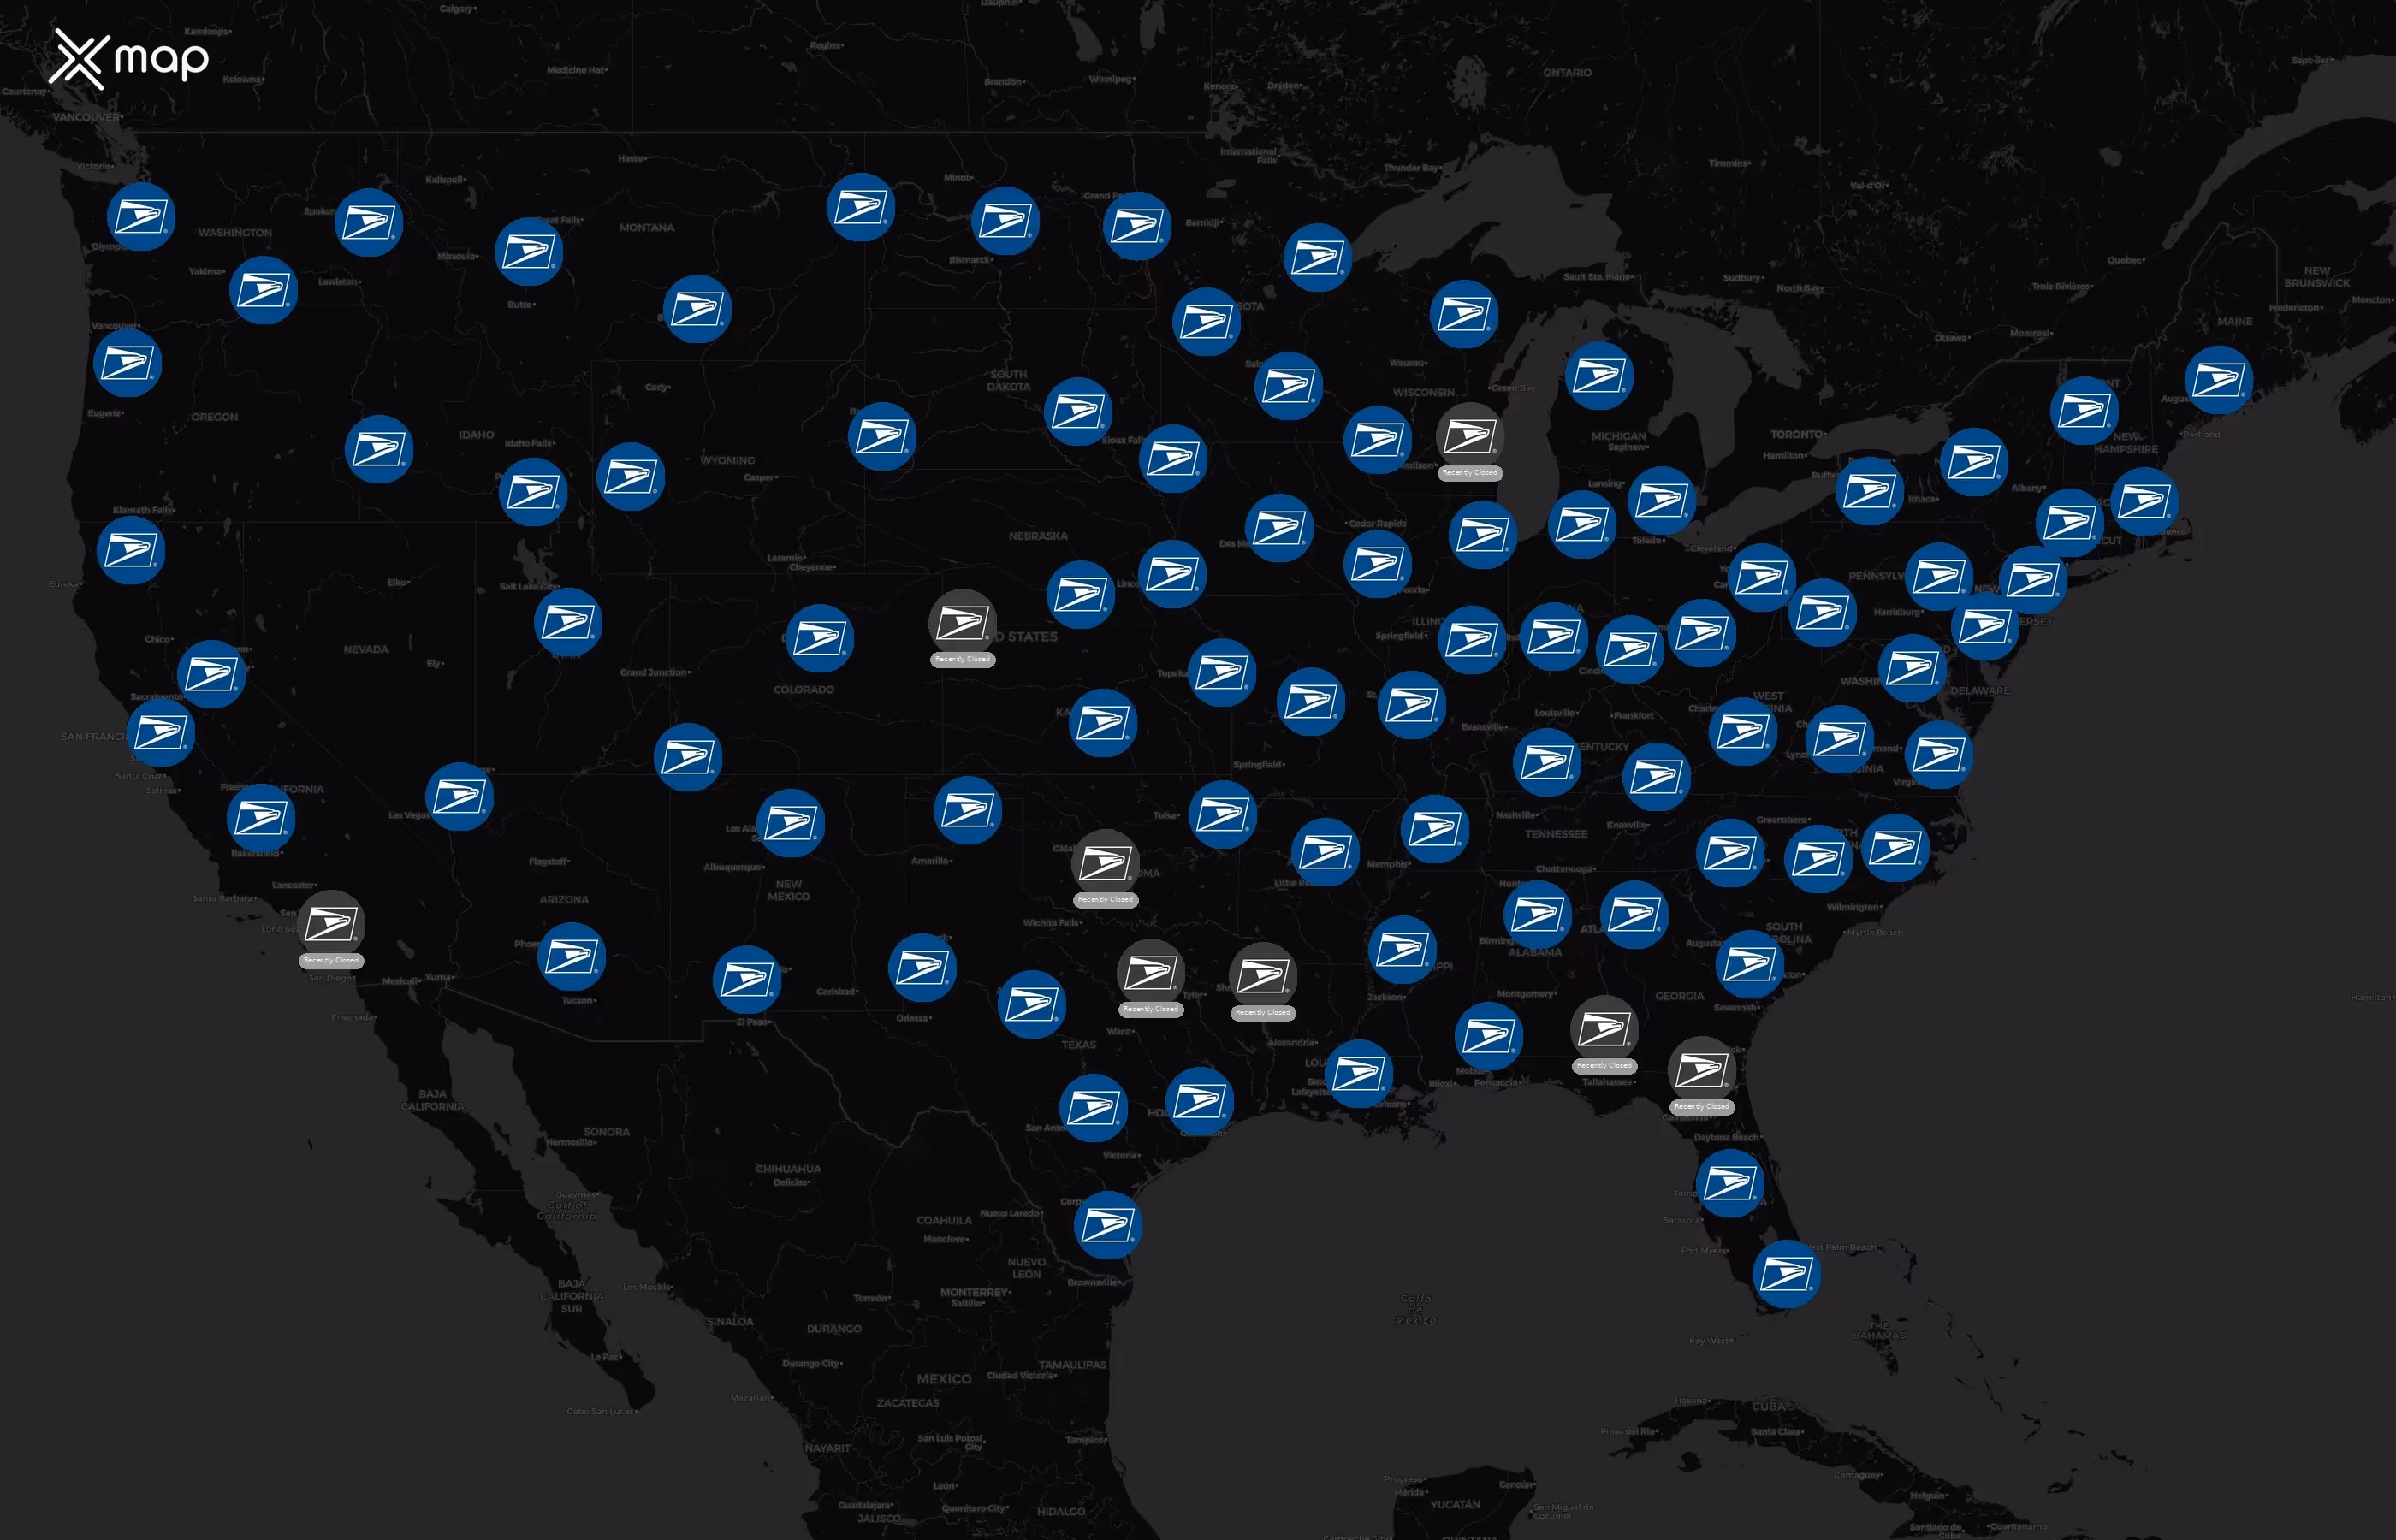
米国内の米国郵政公社所在地の数
2025年11月6日現在、アメリカ合衆国には31,863か所の米国郵政公社があります。米国郵政公社の拠点が最も多い州または準州はニューヨークで、1,848の拠点があり、全体の約 5.8% を占めています。
アメリカ合衆国には米国郵政公社がいくつありますか?

31,863

27,878

31,863

31,863

508
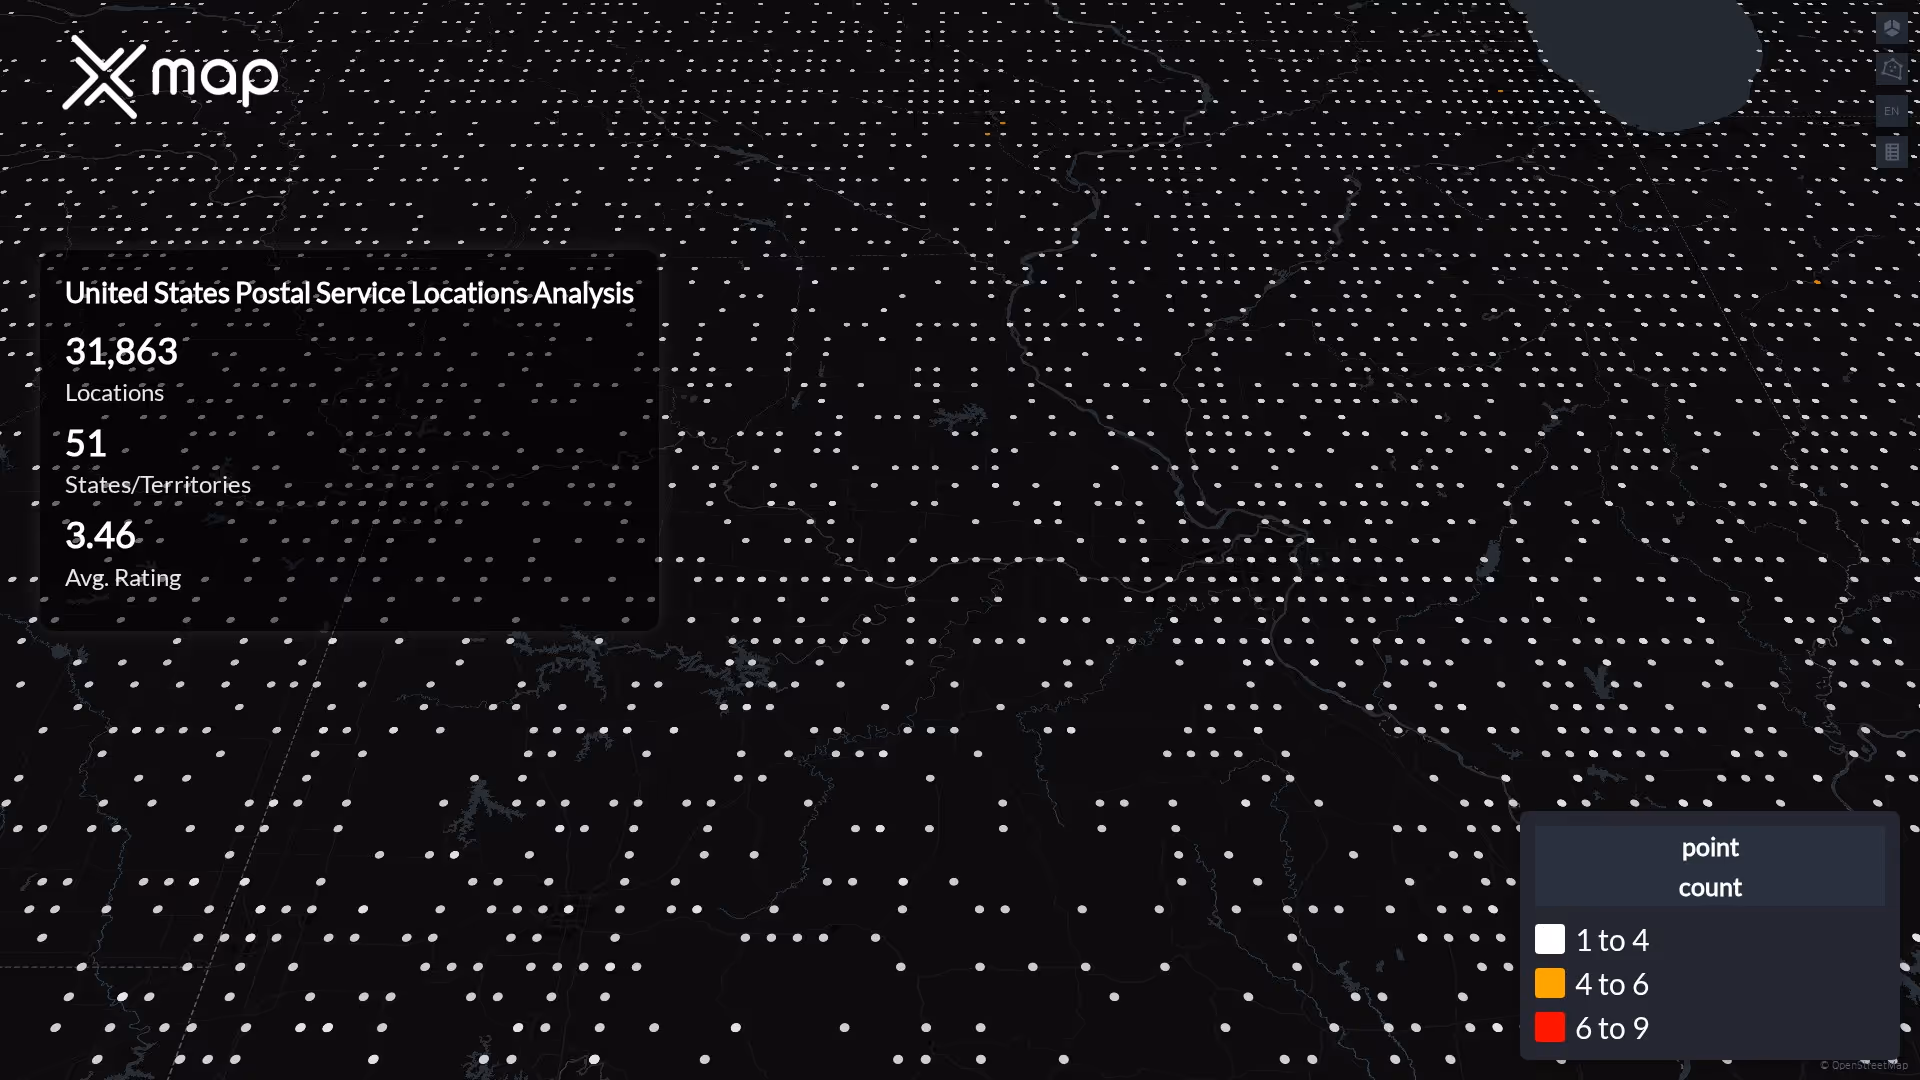
米国全体における米国郵政公社の所在地の州別分布
米国郵政公社は、51の州に31,863の店舗を運営しています。最大のクラスターはニューヨーク、ペンシルベニア、カリフォルニア州で、上位 10 州には 41.5% のサイトが含まれています。ロードアイランド州、デラウェア州、コロンビア特別区では対象範囲が狭くなっています。
アメリカ合衆国で米国郵政公社の所在地の数が最も多い上位10州
米国郵政公社は訪問者エンゲージメントが強く、4930か所が平均トラフィックスコア(平均:66.74)を上回り、1246か所が高訪問者数として認定されています。
米国郵政公社は米国全土で31,863か所を運営しており、ニューヨークは1,848か所(全体の5.8%)と最も多い場所を占めています。上位3州(ニューヨーク、ペンシルベニア、カリフォルニア)は全地域の 16.9% を占め、上位10州は 41.5% を占めています。アクセスが最も良いのはバーモント州、ノースダコタ州、サウスダコタ州で、それぞれ 1 か所あたり 2,600 人未満です。一方、フロリダ、ネバダ、カリフォルニアが最も多く、1 か所あたりの人口は 23,000 人を超えています。
米国郵政公社の一人当たりの洞察
- 米国(バーモント州、ノースダコタ州、サウスダコタ州)では、米国郵政公社への1人あたりのアクセスが最も良好です。
- ニューヨーク、カリフォルニア、テキサス、オハイオ、ミシガンなどの州は、多数の拠点があるにもかかわらず、一人当たりのサービスが行き届いておらず、郊外への拡張需要が見込まれています。
- いくつかの州では、人口増加と米国郵政公社の密度のバランスを取っているため、競争が続くホットスポットとなっています。
アメリカ合衆国で米国郵政公社の所在地が最も多い都市
場所は、ニューヨーク、ロサンゼルス、フィラデルフィア、シカゴ、ヒューストンなどの主要メトロに集中しています。上位 10 都市が米国のサイトの 2.2% を占めています。
ロケーション数でランク付けされた都市トップ10
米国郵政公社は、米国全土で合計31,863か所を運営しています。ニューヨーク州が 239 か所で先頭に立ち、カリフォルニア州ロサンゼルスが92か所と続いています。上位10都市を合わせると、全国のUSPS全拠点の 2.2% を占めています。フィラデルフィアとシカゴはそれぞれ 58 都市で、第 3 位にランクされています。
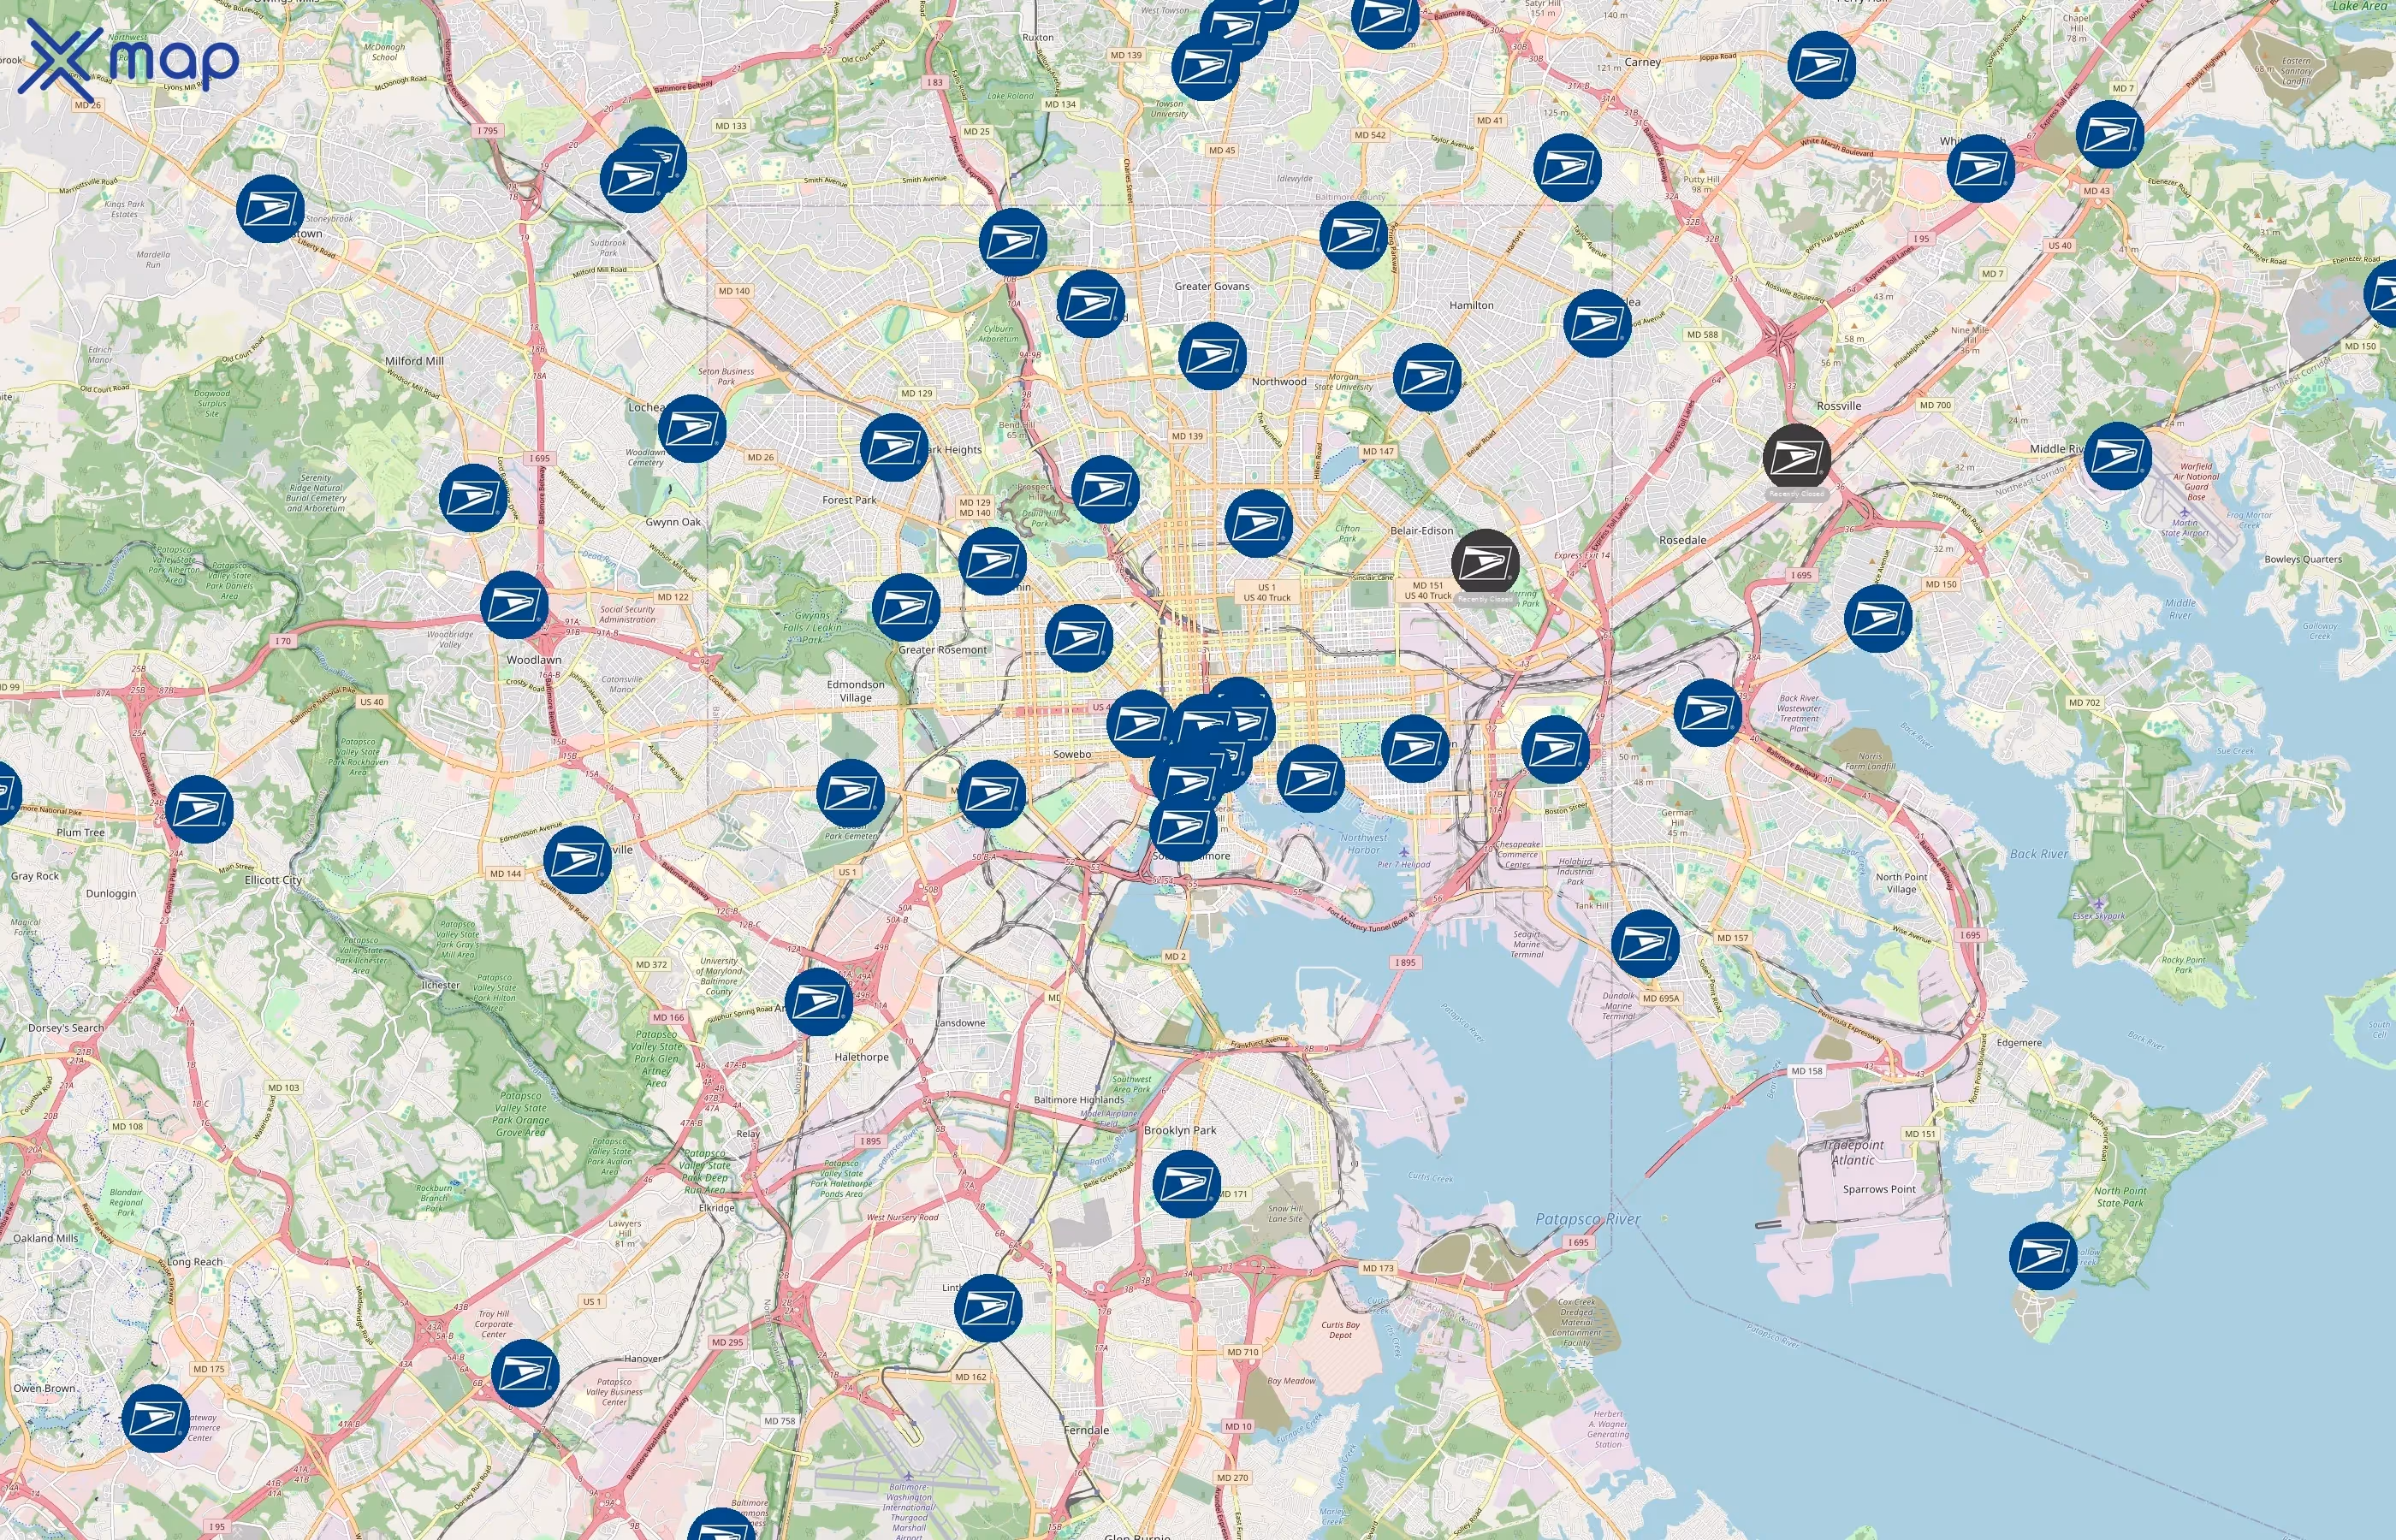
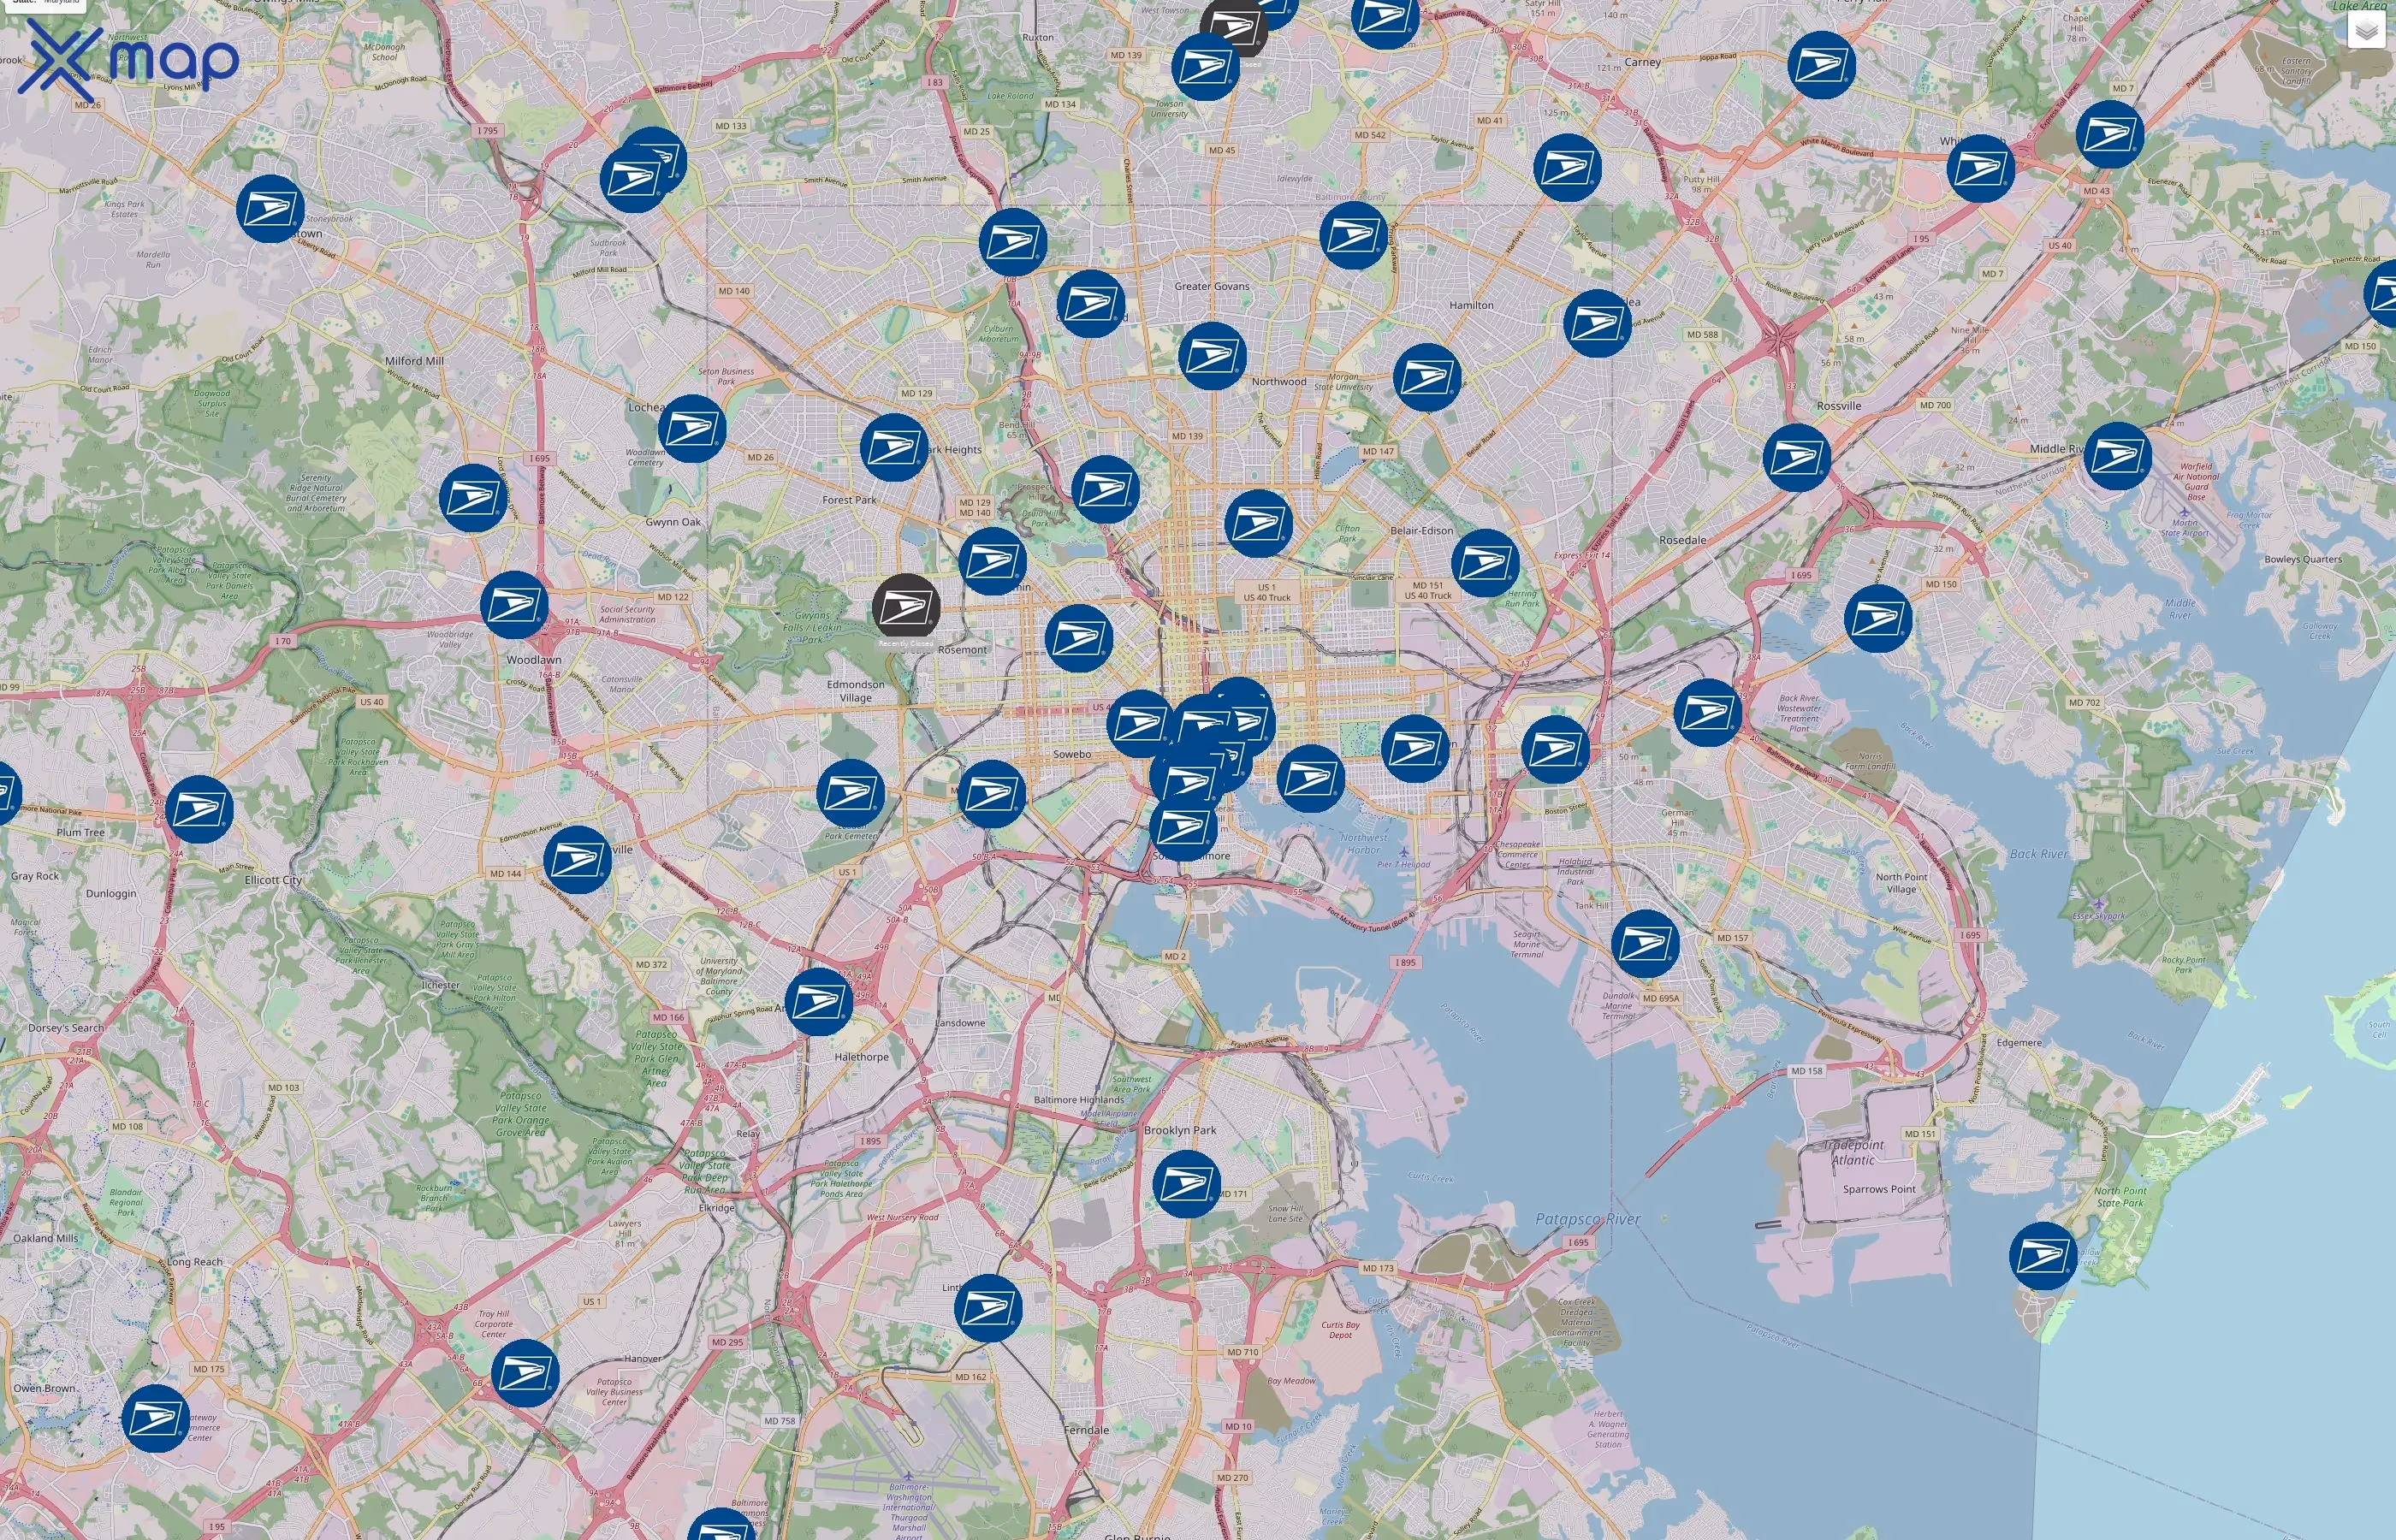
ストリートレベルのホットスポット(複数の米国郵政公社がある最も混雑した通り)
ストリートレベルのクラスターは、同じ地域内に複数の米国郵政公社の拠点がある廊下を示しており、地域的な存在感と一貫性が強いことを示しています。米国郵政公社は、全国で合計31863店舗を運営しています。

米国郵政公社アウトレットのポイントオブインタレストデータをダウンロード
座標、交通パターン、運用状況など、米国全土の米国郵政公社の所在地の完全なデータセットをダウンロードできます。

米国郵政公社の関心地の主な変数
米国郵政公社は、米国全土に31863の拠点を構えています。主要な変数は、全国の米国郵政公社の所在地に最も影響の大きい側面を示しています。これにより、米国郵政公社がどのように運営されているかをさまざまな観点から詳しく見ることができます。
米国郵政公社所在地ごとの平均カバーエリア (州別)
米国郵政公社のデータによると、テキサス州は土地面積で695,668km²で最大の州であり、バージニア州は記載されている州の中で110,786km²と最も小さい州です。ニューヨーク州とペンシルベニア州は、テキサス州やカリフォルニア州に比べて土地面積が小さいにもかかわらず、USPS の拠点数が最も多く、それぞれ 1,848 か所と 1,832 か所です。特に、カリフォルニア州の面積は423,965km²ですが、ニューヨークやペンシルバニアよりも所在地の数が少ない(1,706か所)。
米国郵政公社の事業状況(オープンとクローズ)

米国郵政公社は主に主要州でオープンロケーションを運営しており、テキサス州は上位10州の中で98.9%と最も高いオープン率を示しています。ニューヨークは合計で 1,848 か所でリードしており、そのうちの 1,820 か所が開店しています。カリフォルニア州は、オープン率が 96.9% とやや低いものの、クローズされたロケーションの数が最も多いのは25か所です。全体として、これらの州のオープン率は 96.9% から 98.9% と狭い範囲です。
米国郵政公社所在地の交通データ (州別)
このビューでは、米国郵政公社の近くのアクティビティを州全体で比較しています。31,863 か所のサイトで観測されたトラフィックスコアを使用して、最も混雑している市場、平均を上回る場所のシェアが高い州、およびアクティビティが比較的少ない地域が強調されています。パフォーマンスのベンチマークや現場業務の優先順位付け、事業拡大や最適化の機会の特定に活用してください。
米国郵政公社の上位10州で、混雑しているのはどの場所ですか?
米国郵政公社の最も混雑する場所は、米国のさまざまな州に分散しています。カリフォルニア州は 197 か所の利用者が多い地域で最も多く、全 1,706 か所のうち 11.5% を占めています。テキサス州に続き 164 か所の混雑した拠点があり、合計 1,690 か所のうち 9.7% を占めています。ニューヨークにはビジター拠点が 144 か所あり、全 1,848 拠点の 7.8% を占めています。
米国郵政公社所在地のカスタマーレビューと評価
このセクションでは、米国郵政公社に対するお客様の感想をまとめています。31,863 か所の評価とレビューの合計を使用して、スコアが一貫して高く、フィードバックの量が最も多い地域に焦点を当てます。星による平均評価は質の高さを反映し、レビュー総数はネットワーク全体でのエンゲージメントとリーチを示します。
平均評価
米国郵政公社の平均評価が最も高いのはアイオワ州で、スコアは3.8です。イリノイ州、ミズーリ州、ペンシルベニア州、バージニア州の平均評価はそれぞれ3.5です。レビュー数はテキサス州が97,769件でトップで、続いてカリフォルニアが91,786件、ニューヨークが75,236件となっています。イリノイ州とペンシルベニア州もレビュー数の上位 5 位にランクされています。
レビュー数
米国郵政公社はテキサス州からのレビュー数が97,769件と最も多く、続いてカリフォルニアとニューヨークがそれぞれ91,786件と75,236件でした。アイオワ州の平均評価は3.8と最も高く、イリノイ州、ミズーリ州、ペンシルベニア州、バージニア州の平均評価はそれぞれ3.5でした。イリノイ州とペンシルベニア州も総レビュー数で上位の州にランクインし、それぞれ40,284件と36,090件のレビューがありました。
確認済みの連絡先情報が記載された米国郵政公社の場所
連絡先情報
米国郵政公社は、米国内のすべての上場州で 100% の電話対応を実現しました。電話の設置場所数が最も多いのはニューヨークで 1,848 件で、続いてペンシルベニア州が 1,832 件、カリフォルニア州が 1,706 件でした。テキサス州、イリノイ州、オハイオ州を含む各州では、全拠点の電話対応範囲が完全にカバーされていると報告されています。
米国郵政公社のポイントオブインタレストデータのユースケース
市場分析
米国郵政公社のPOIデータにより、フットプリントと需要を明確に測定できます。アナリストは、州や都市を場所の数でランク付けし、対象範囲を1人当たりの比較できます。また、トラフィック・スコアとレビュー・ボリュームを使用して、業績の高い市場やサービスの行き届いていない地域を特定できます。その結果、飽和状態、成長機会、業績外れ値を客観的に把握できます。
サイト選択
ネットワーク計画では、このデータは、立地密度、場所ごとの人口、および近隣の交通量を使用して候補商圏をスコアリングするのに役立ちます。チームは、店舗から最も近い距離から競合リスクを評価したり、主要な通路に沿って空白を浮き彫りにしたり、観察された活動が最も活発な小売店街、キャンパス、交通機関に近い場所に優先順位を付けたりできます。
都市計画
計画担当者は、クラスターとサービスギャップをマッピングして、近隣レベルでの商業アクセスを把握できます。一人当たりの調査ではアクセスが制限されているコミュニティが強調され、開館や閉鎖の変化は活動の変化を示唆しています。これらの洞察は、回廊の活性化、街並みと交通計画、データ主導のゾーニングの決定に役立ちます。
このxMapのPOIデータは企業にどのように役立ちますか?
- 精度と精度: xMap データは精度の高いデータを提供するため、欠陥のある情報に基づいて誤った判断を下す可能性が最小限に抑えられます。
- 完全なデータ: xMapを使用すると、企業は包括的で完全なデータにアクセスできるため、知識のギャップを効果的に埋め、意思決定のための包括的なビューを提供できます。
- 最新情報: xMapは、提供されたデータが定期的に更新されることを保証します。これにより、企業は現在の傾向や状況に合わせて、動的でタイムリーな意思決定を行うことができます。
- スケーラビリティ: xMap データは、さまざまな事業規模や要件に対応するインサイトを提供することで、事業を効率的に拡大することができます。
- 分析力: xMapデータの分析を活用することで、パターンや傾向を特定できるため、企業の戦略的計画と予測が強化されます。
米国郵政公社のポイントオブインタレストデータをダウンロード

米国内の米国郵政公社所在地の数
