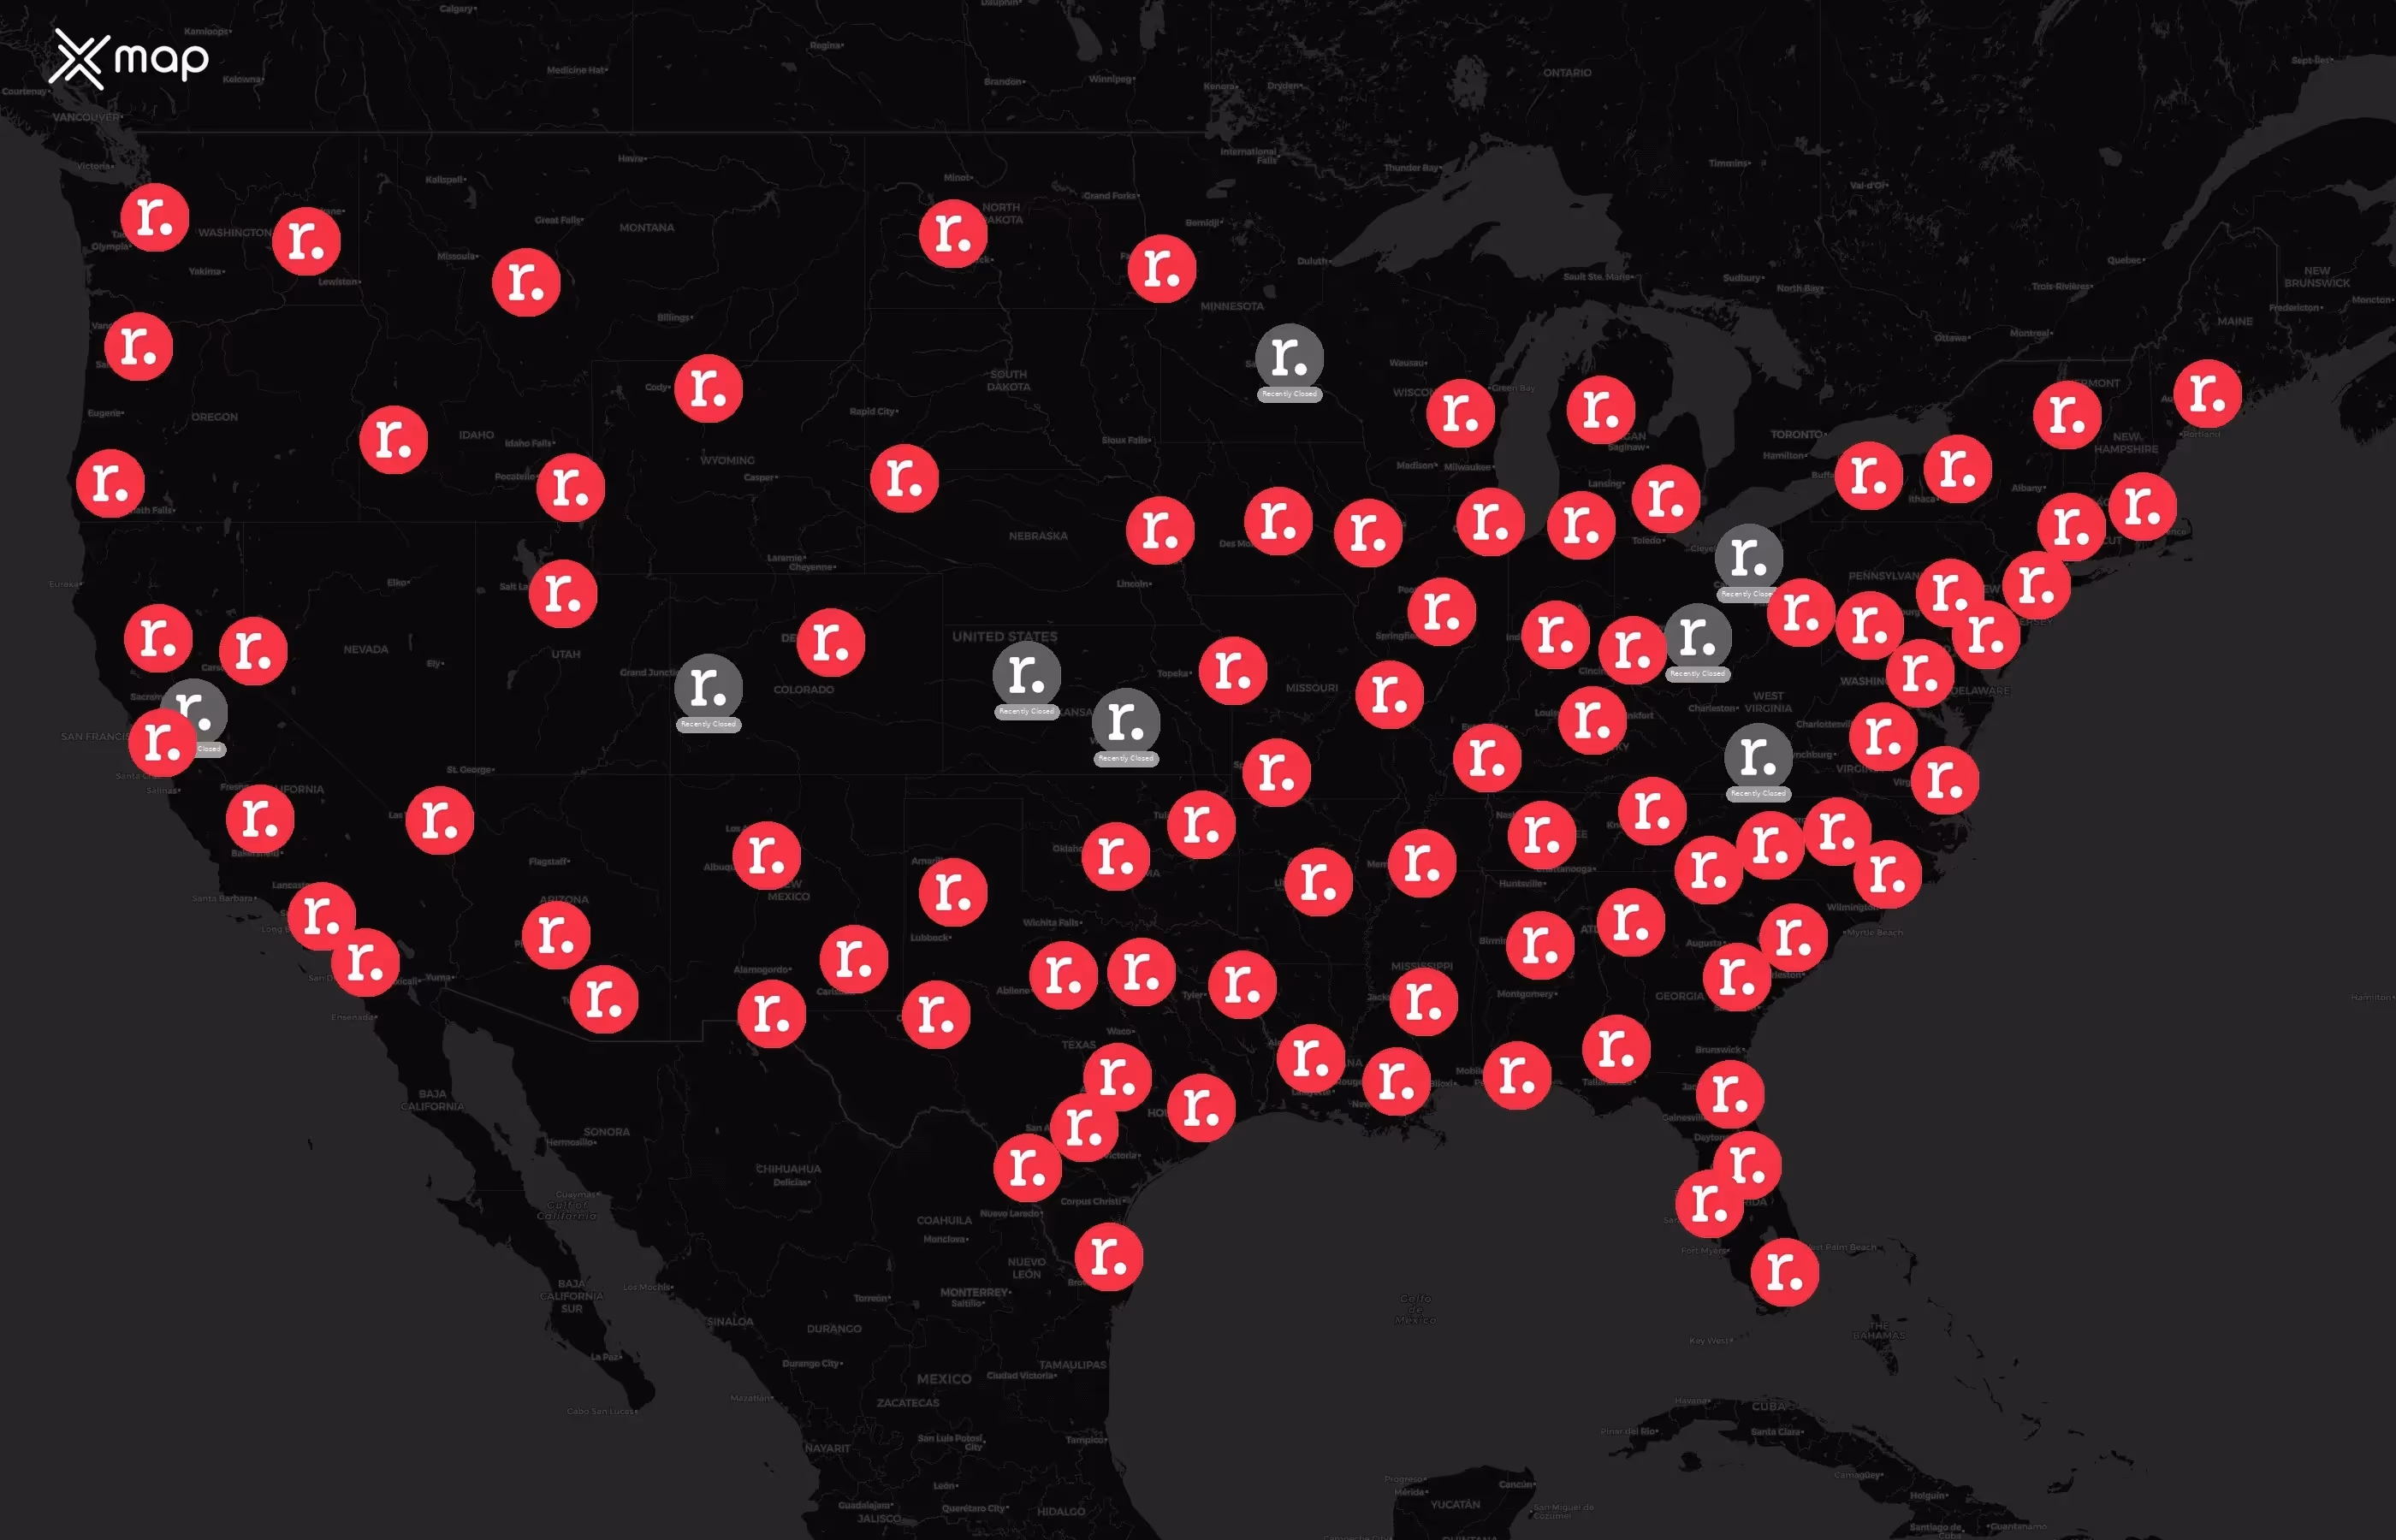
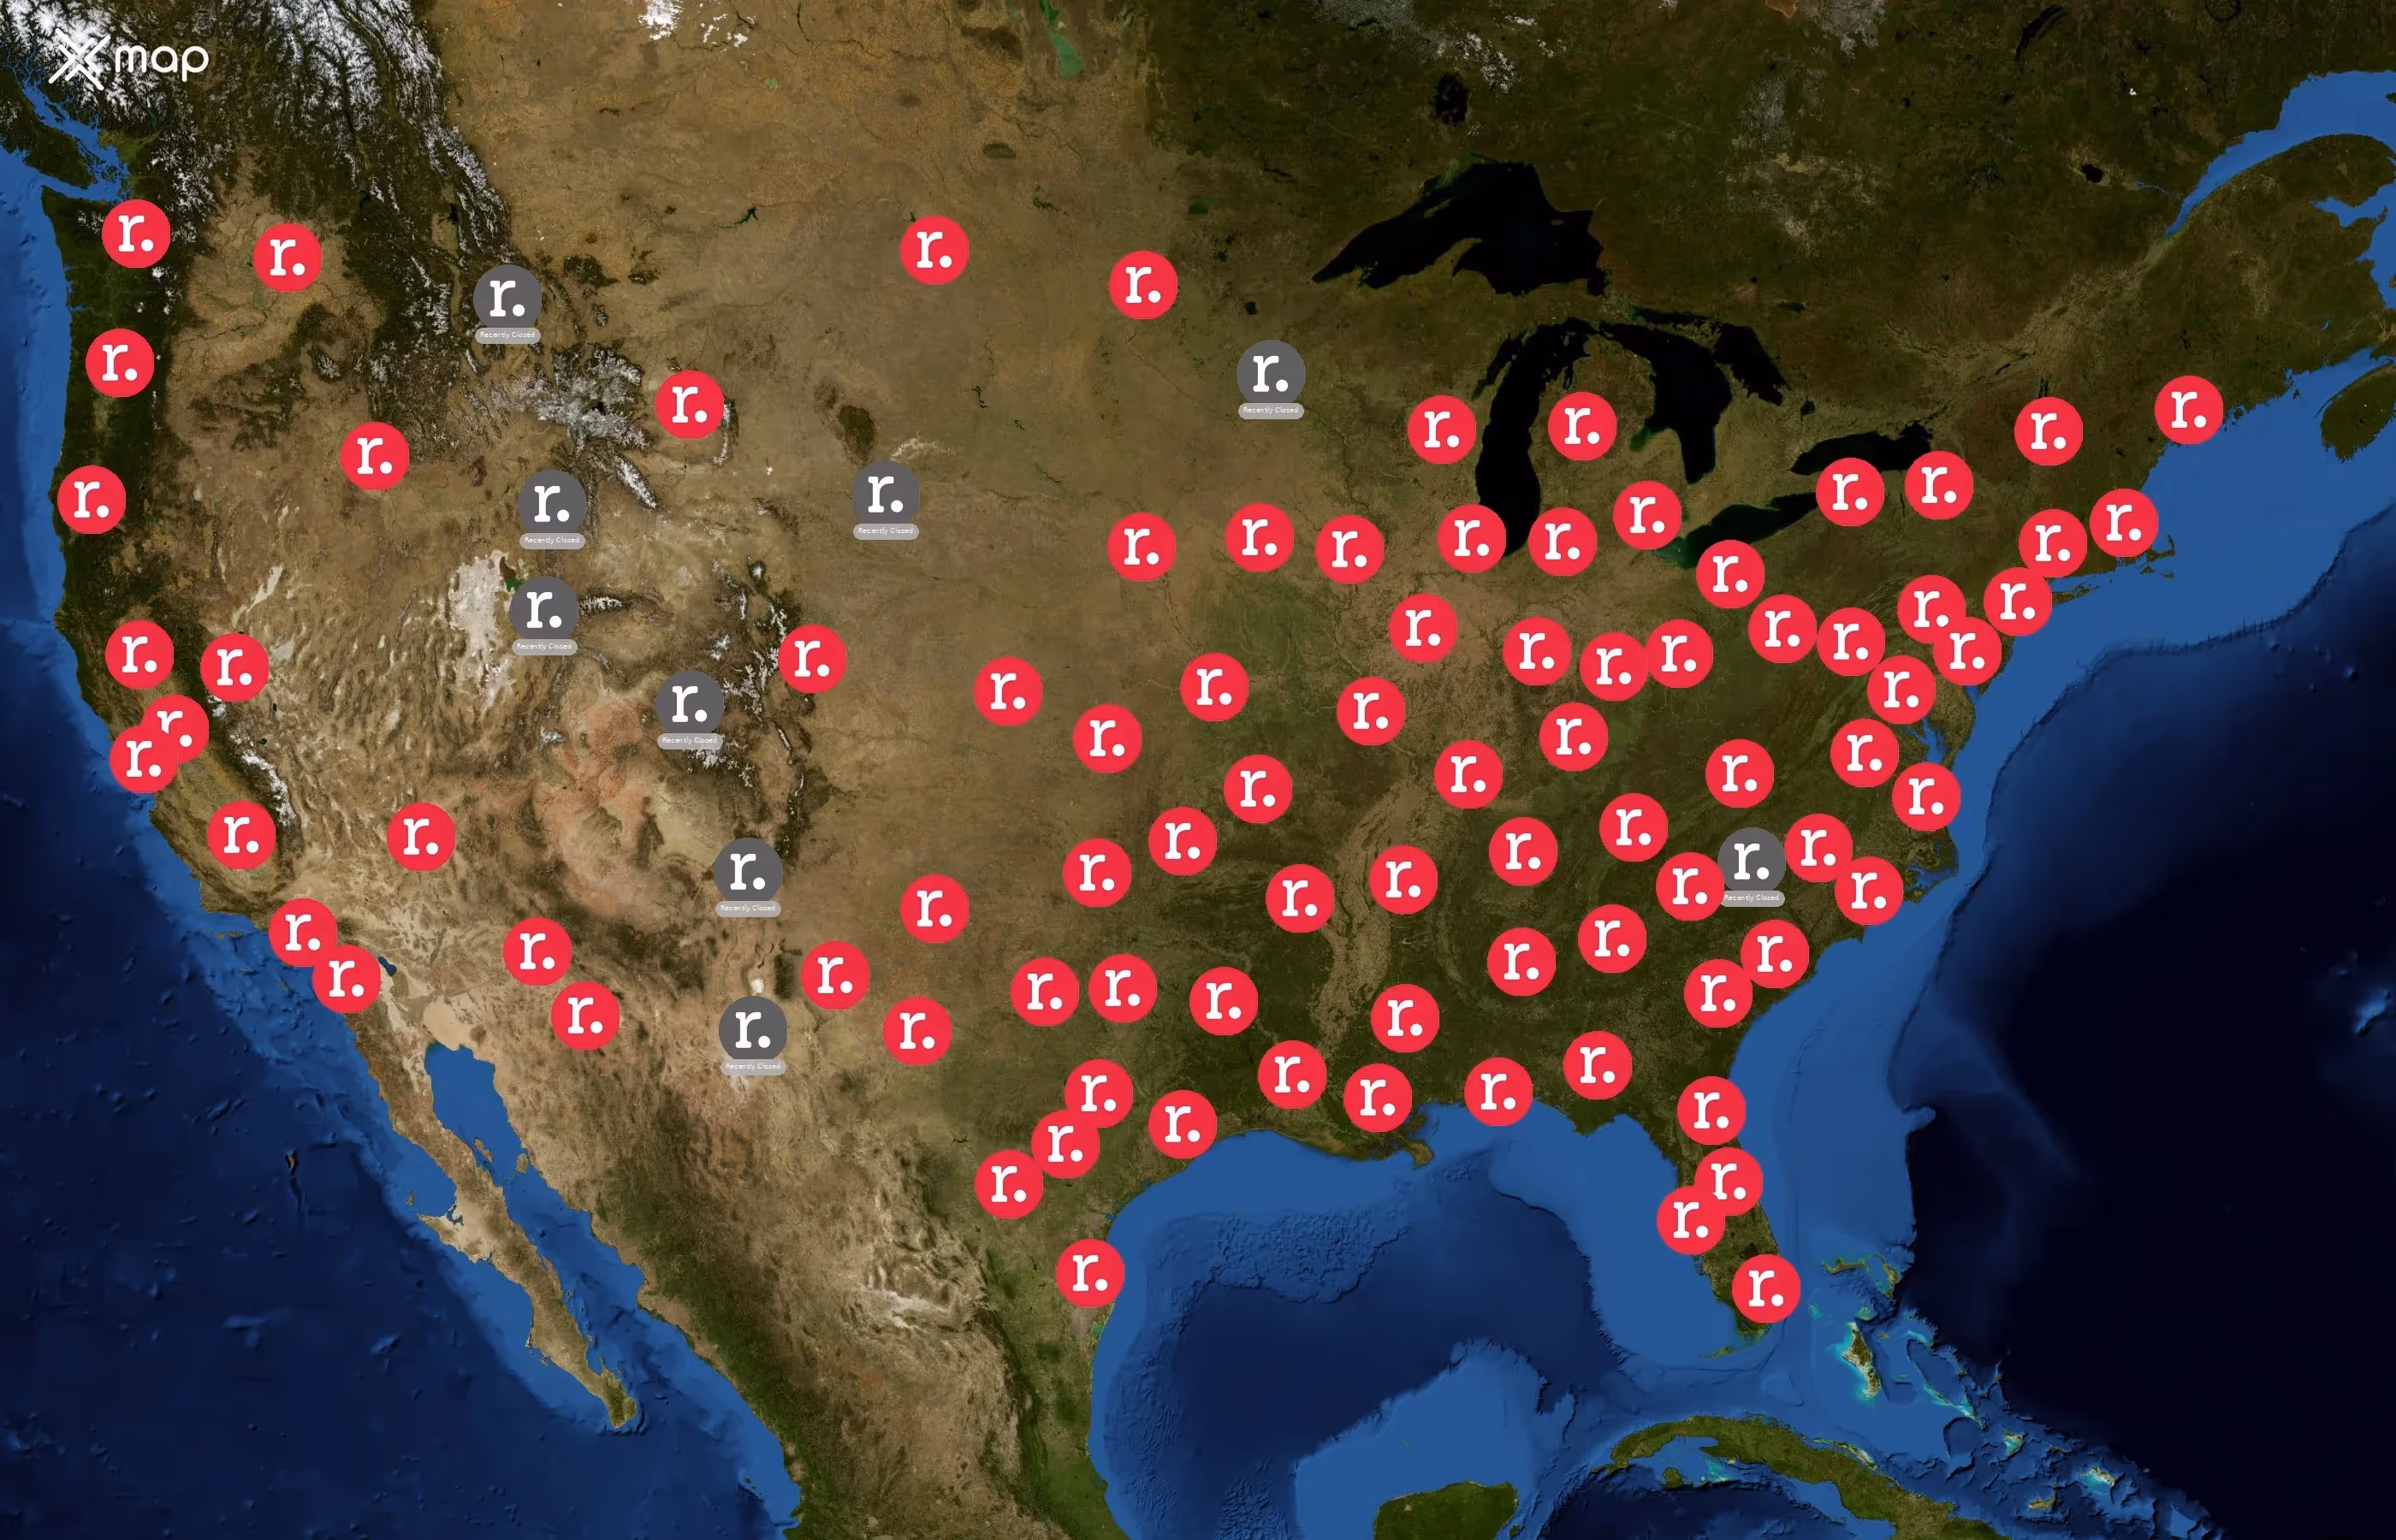
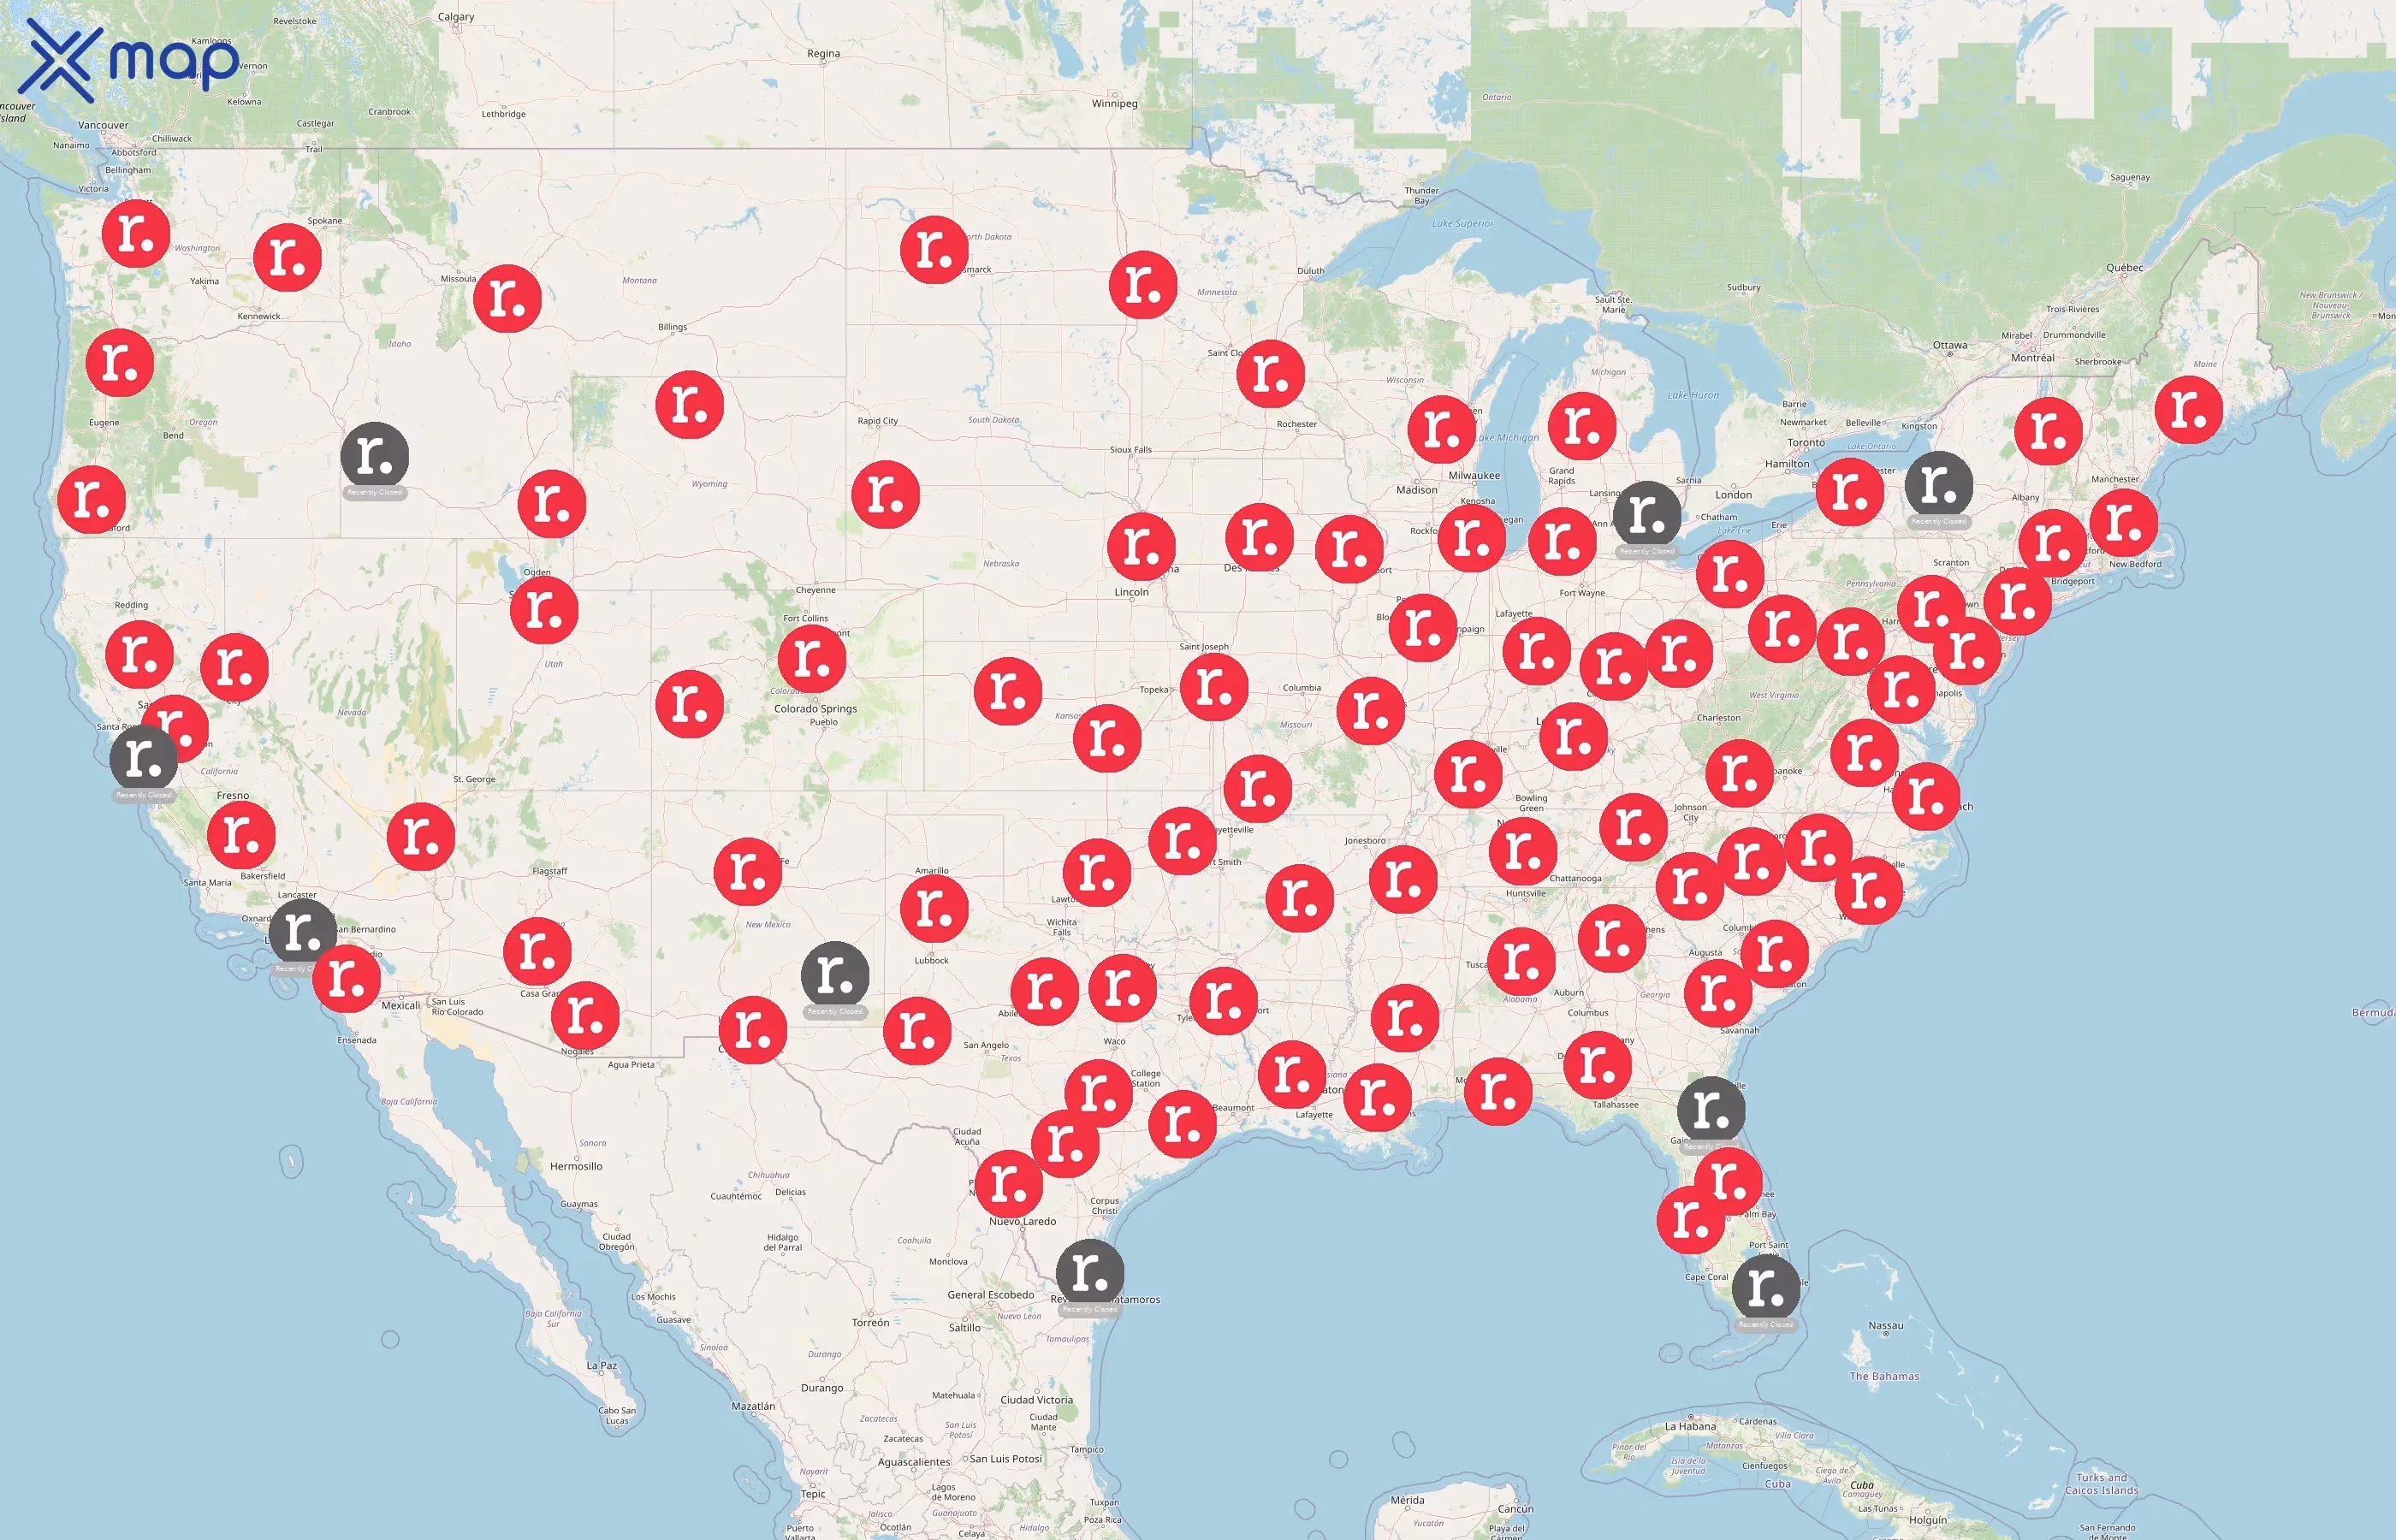
アメリカ合衆国におけるレッドボックスの拠点数
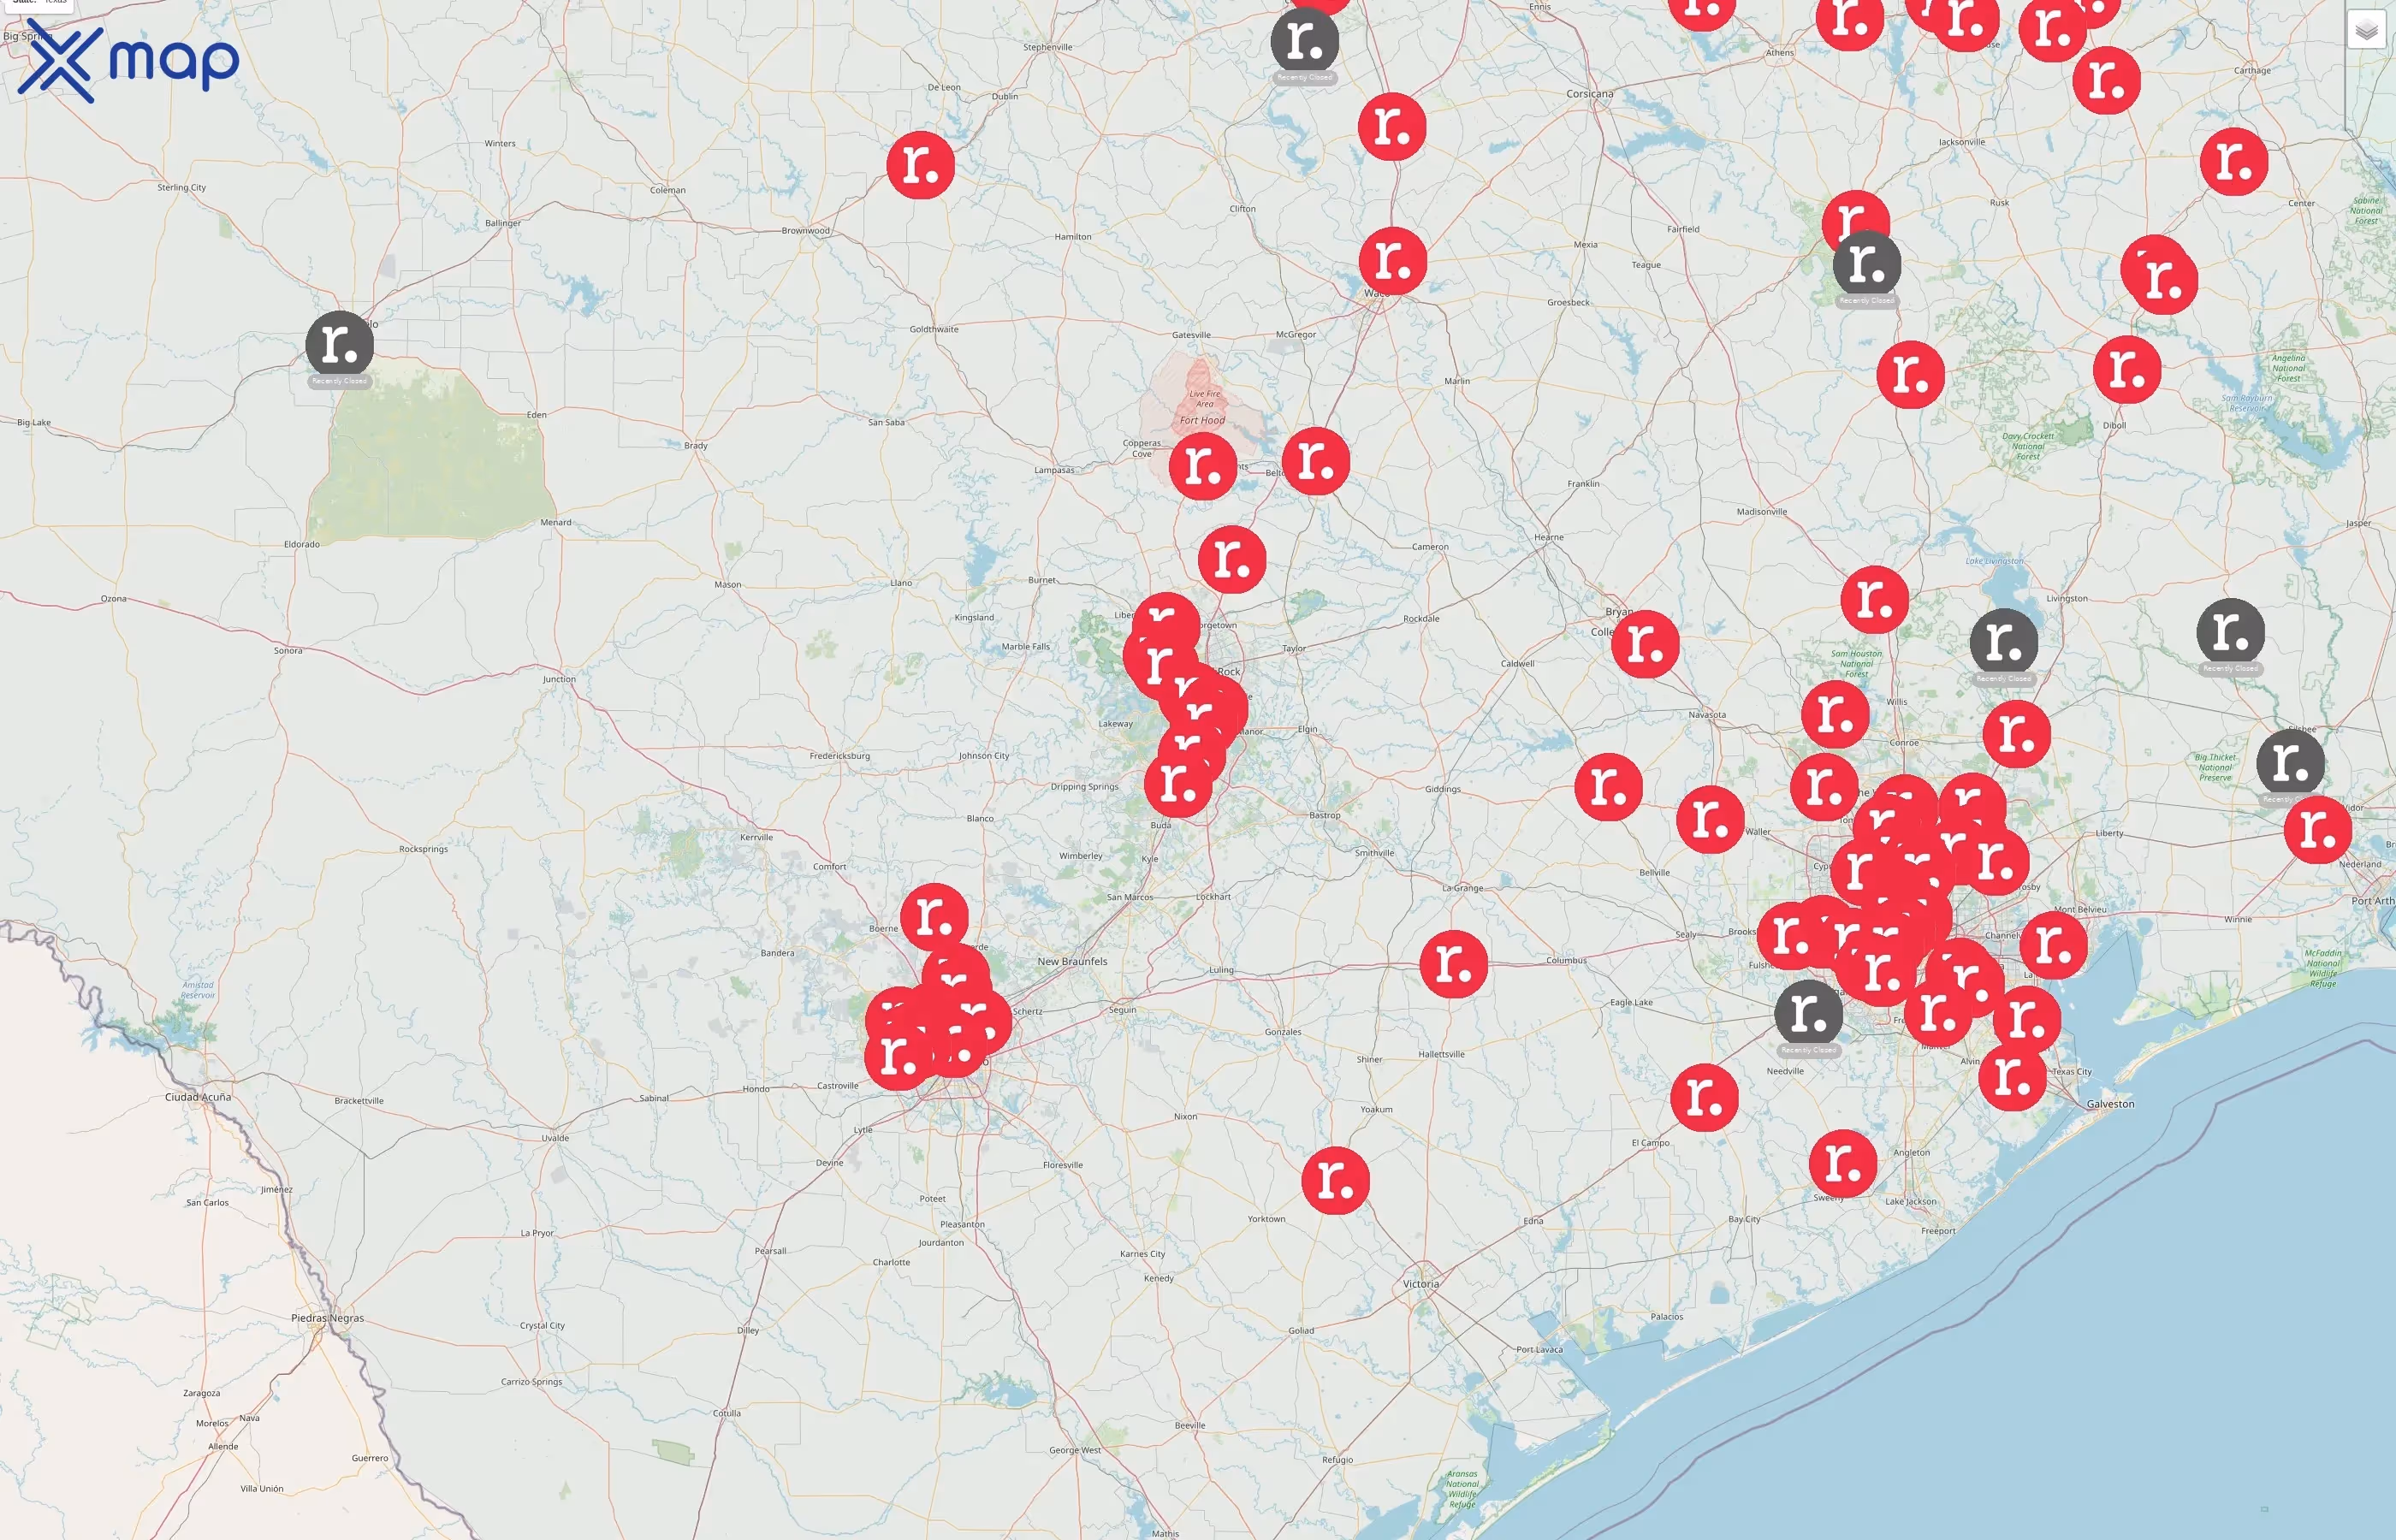
2025年11月6日現在、アメリカ合衆国には35,224か所のレッドボックス拠点があります。Redbox ロケーションが最も多い州または準州はテキサス州で、3,625 のサイトがあり、全体の約 10.3% を占めています。
アメリカにはレッドボックスがいくつありますか?

35,224

24,020

35,224

35,224

16,545
アメリカ合衆国全域の州別のレッドボックスロケーションの分布
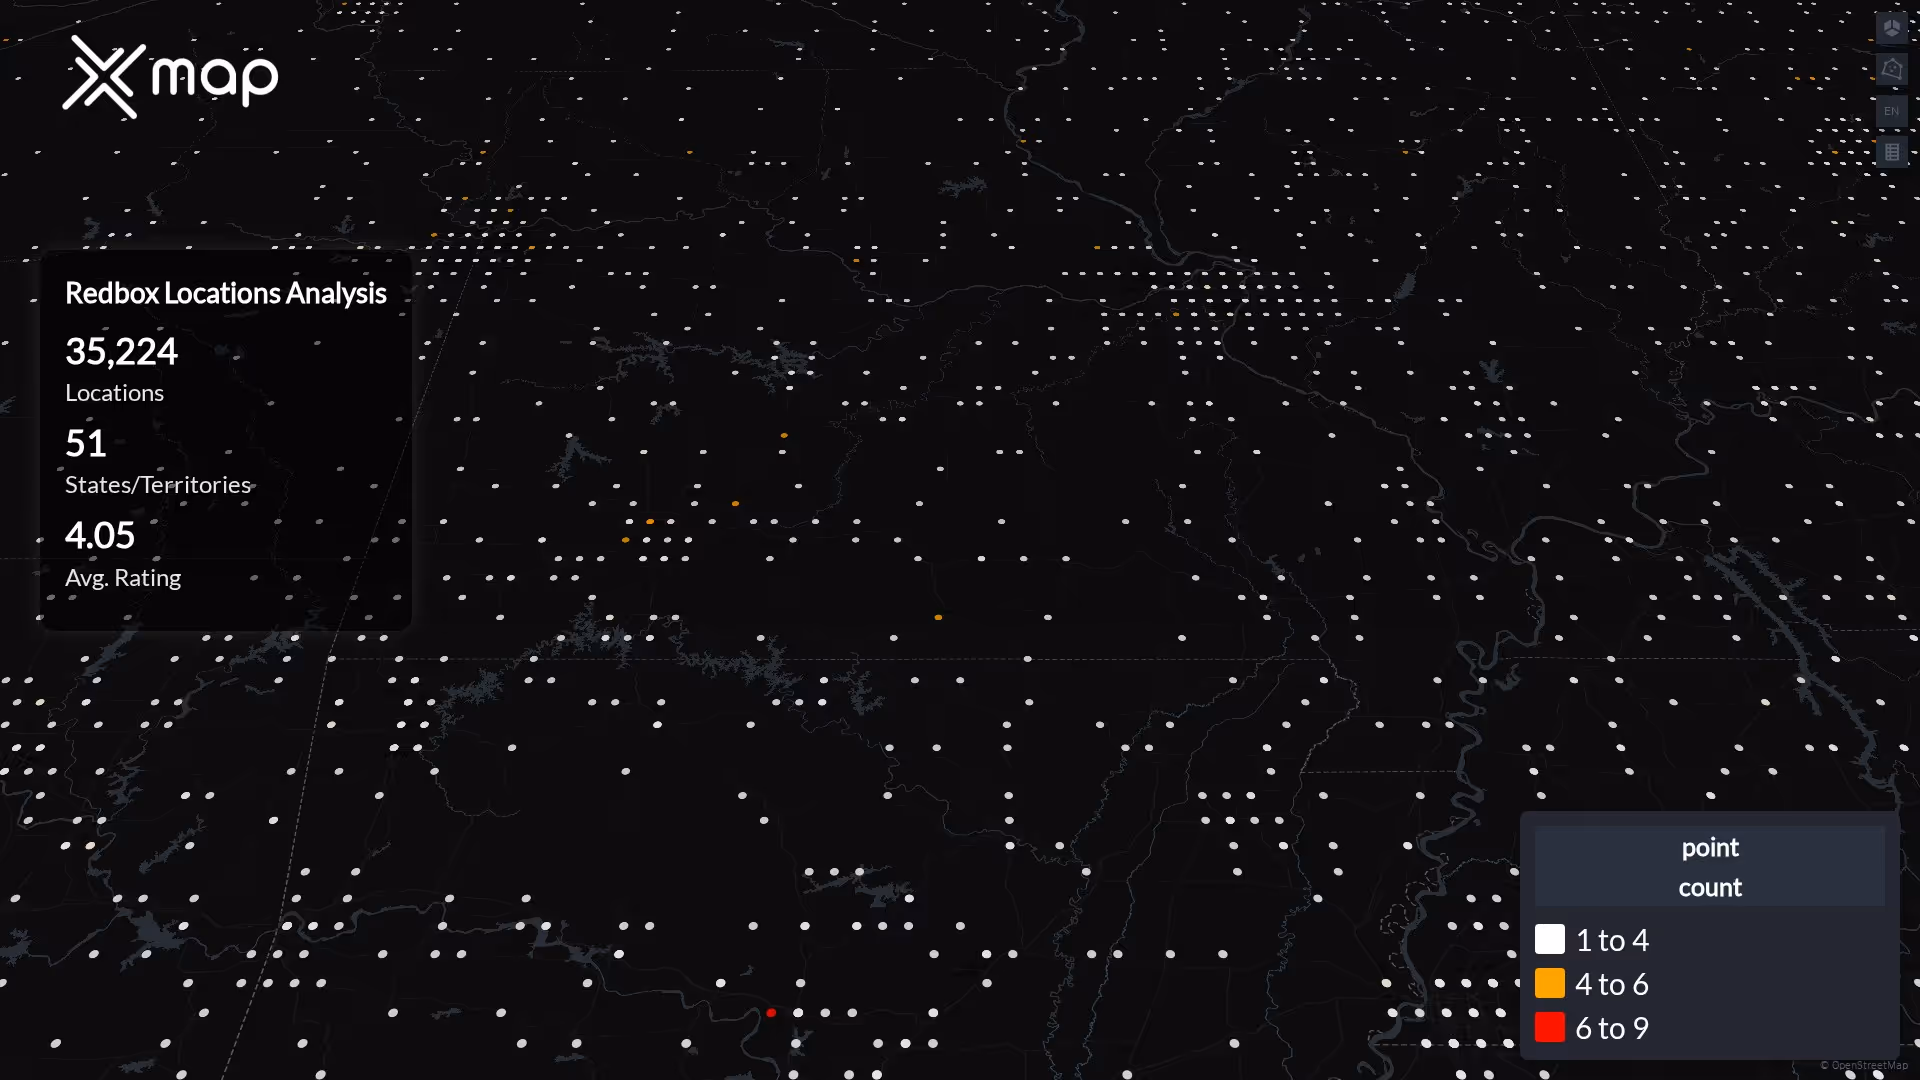
レッドボックスは、51の州に35,224の拠点を構えています。最大のクラスターはテキサス州、カリフォルニア州、フロリダ州にあり、上位 10 州には 49.8% のサイトが含まれています。ノースダコタ州、アラスカ州、およびコロンビア特別区では対象範囲が狭くなっています。
米国で Redbox ロケーションの数が最も多い上位10州
レッドボックスでは、訪問者のエンゲージメントが強く、平均トラフィックスコア(平均:50.94)を上回る場所が 5511 か所、訪問数が多い地域は 1,609 か所でした。
Redboxは全米で35,224拠点を運営しており、テキサス州が3,625拠点(全体の10.3%)でリードしており、続いてカリフォルニア州とフロリダ州がそれぞれ3,017か所と2,690か所を占めています。上位3州は全拠点の26.5%を占め、上位10州は全体のほぼ半分(49.8%)を占めています。ワイオミング州、アーカンソー州、ユタ州は、場所ごとの人口が4,661人から6,327人と最も少なく、アクセスが最も良好です。これとは対照的に、ニューヨーク、コロンビア特別区、ニュージャージーは最も活気のある市場で、それぞれの場所あたりの人口は 19,800 人を超えています。
一人当たりのレッドボックス型インサイト
- Redbox へのアクセスは、各州(ワイオミング州、アーカンソー州、ユタ州)で 1 人あたりのアクセスが最も良好です。
- カリフォルニア州、ジョージア州、ペンシルベニア州、イリノイ州、オハイオ州などの州は、多数の拠点があるにもかかわらず、一人当たりのサービスが行き届いておらず、郊外への拡張需要が見込まれています。
- いくつかの州では、人口増加とレッドボックス密度のバランスを取っているため、競争が続くホットスポットとなっています。
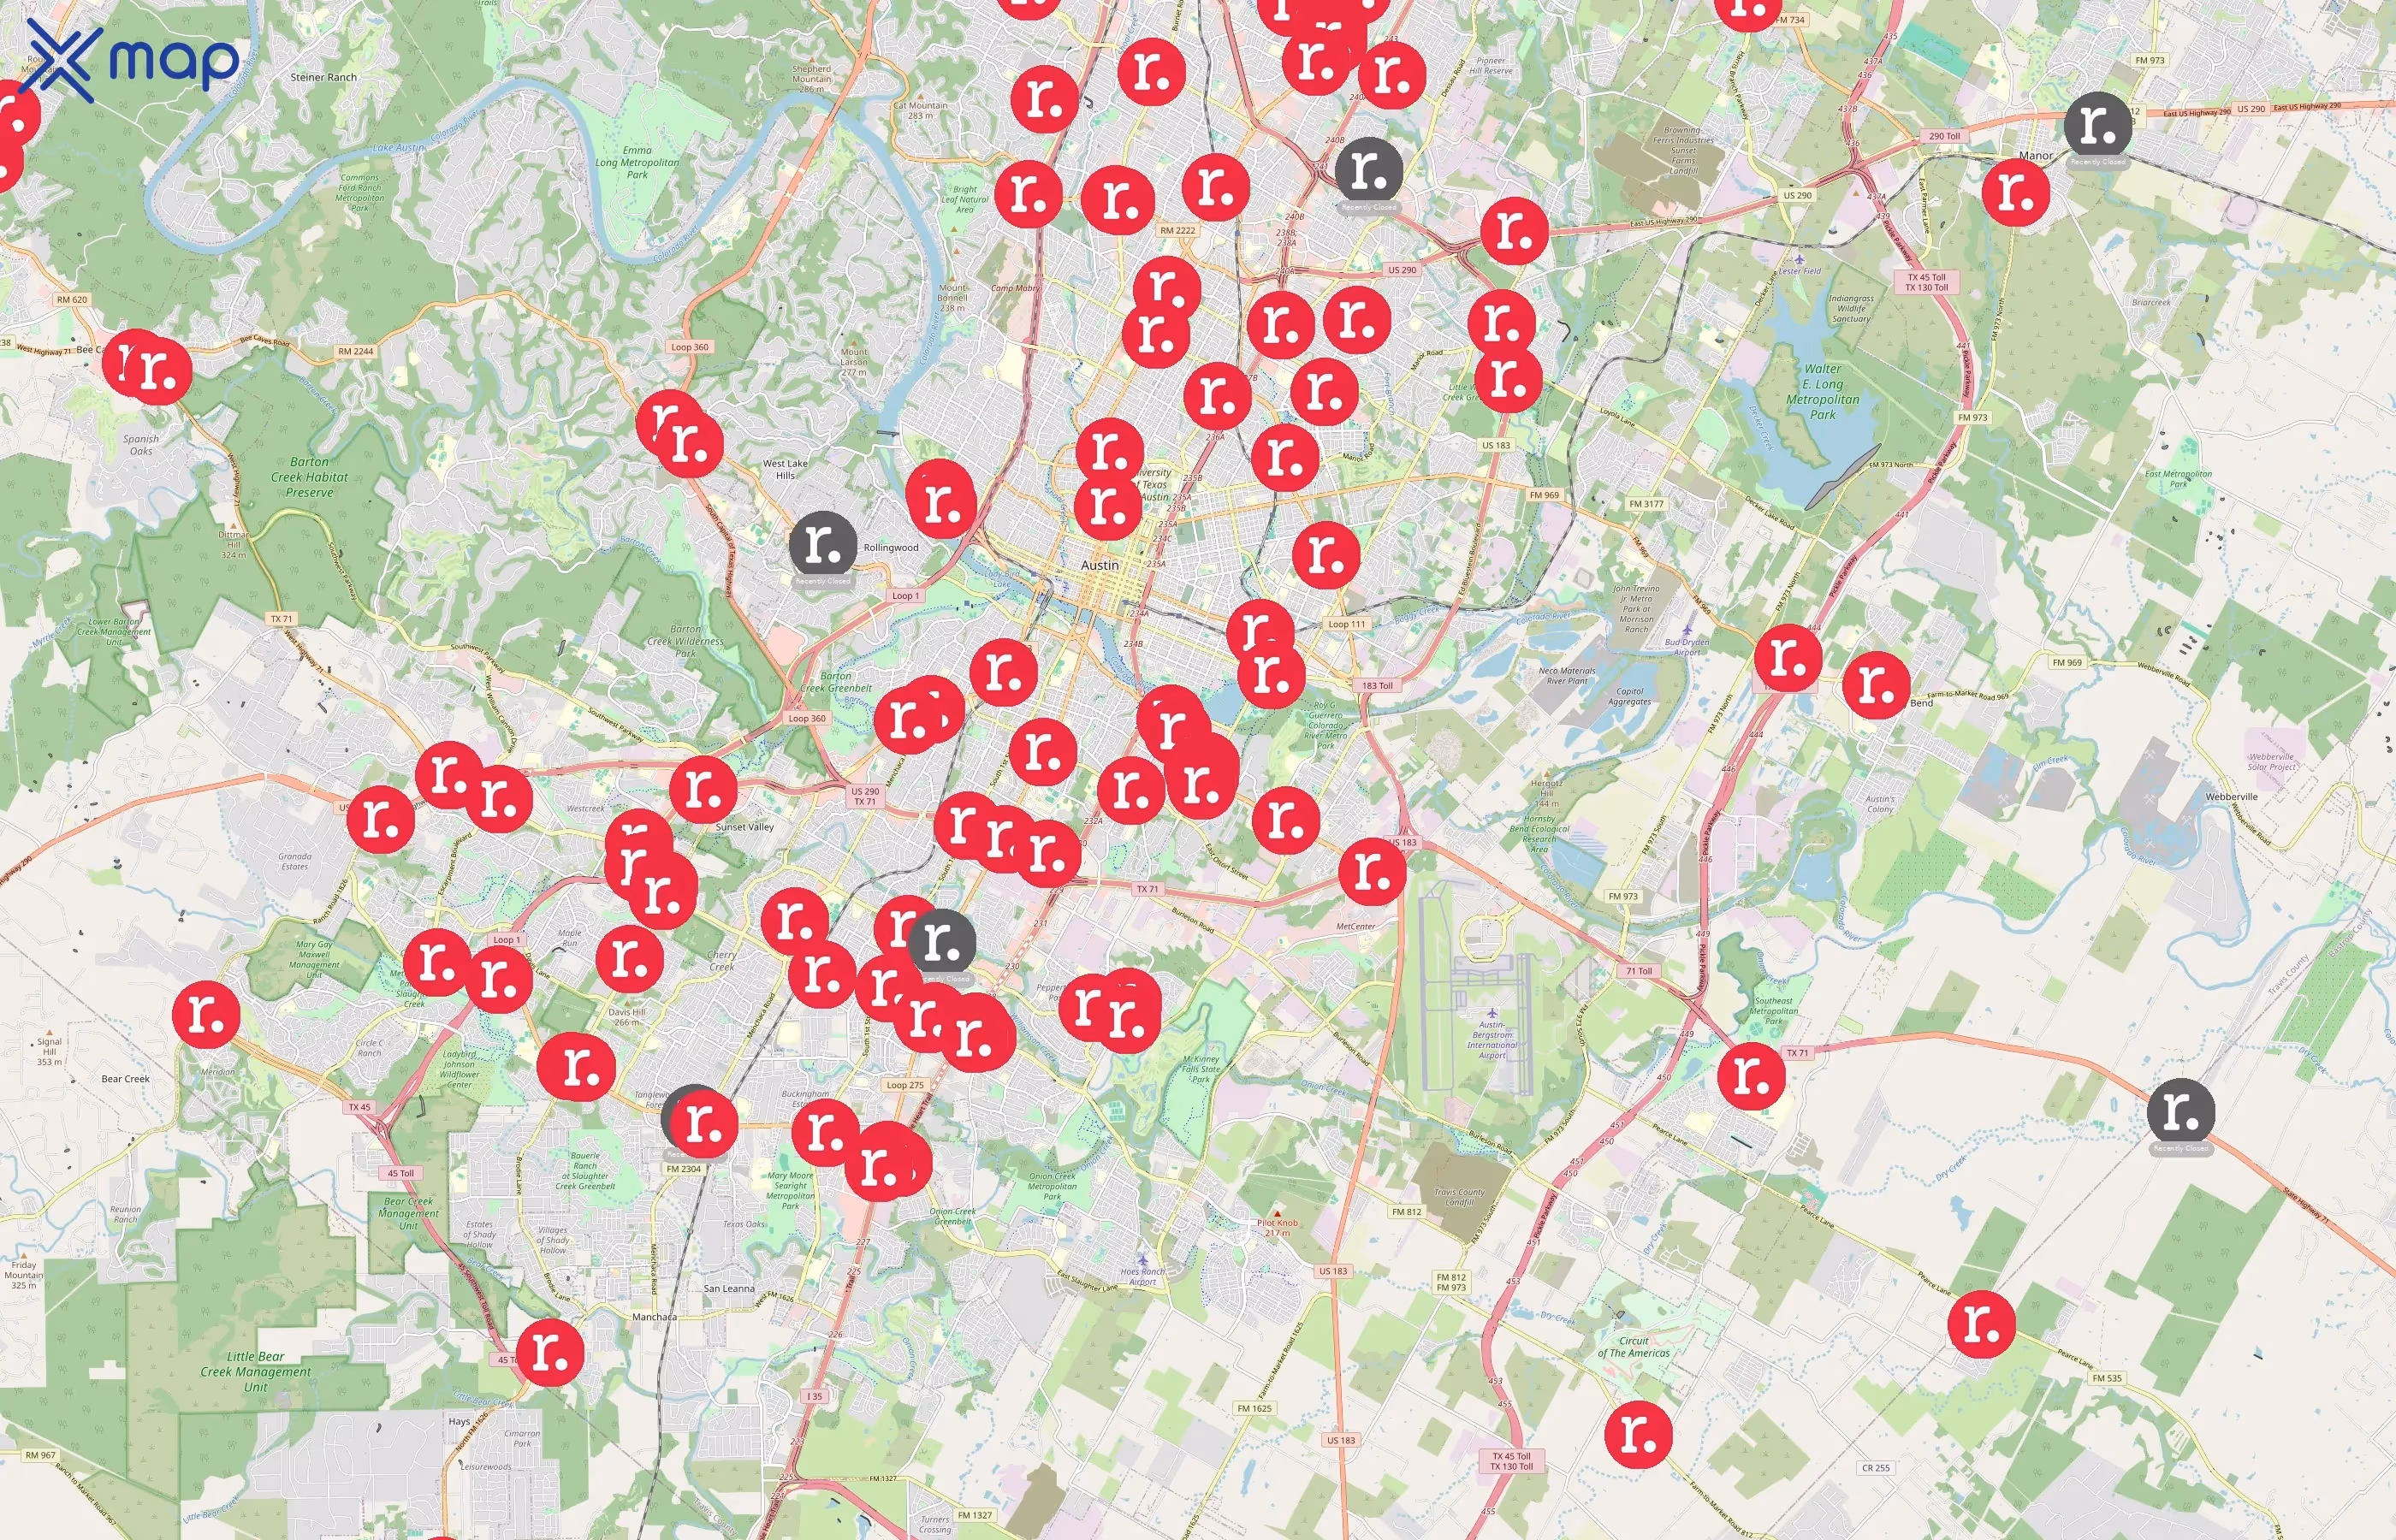
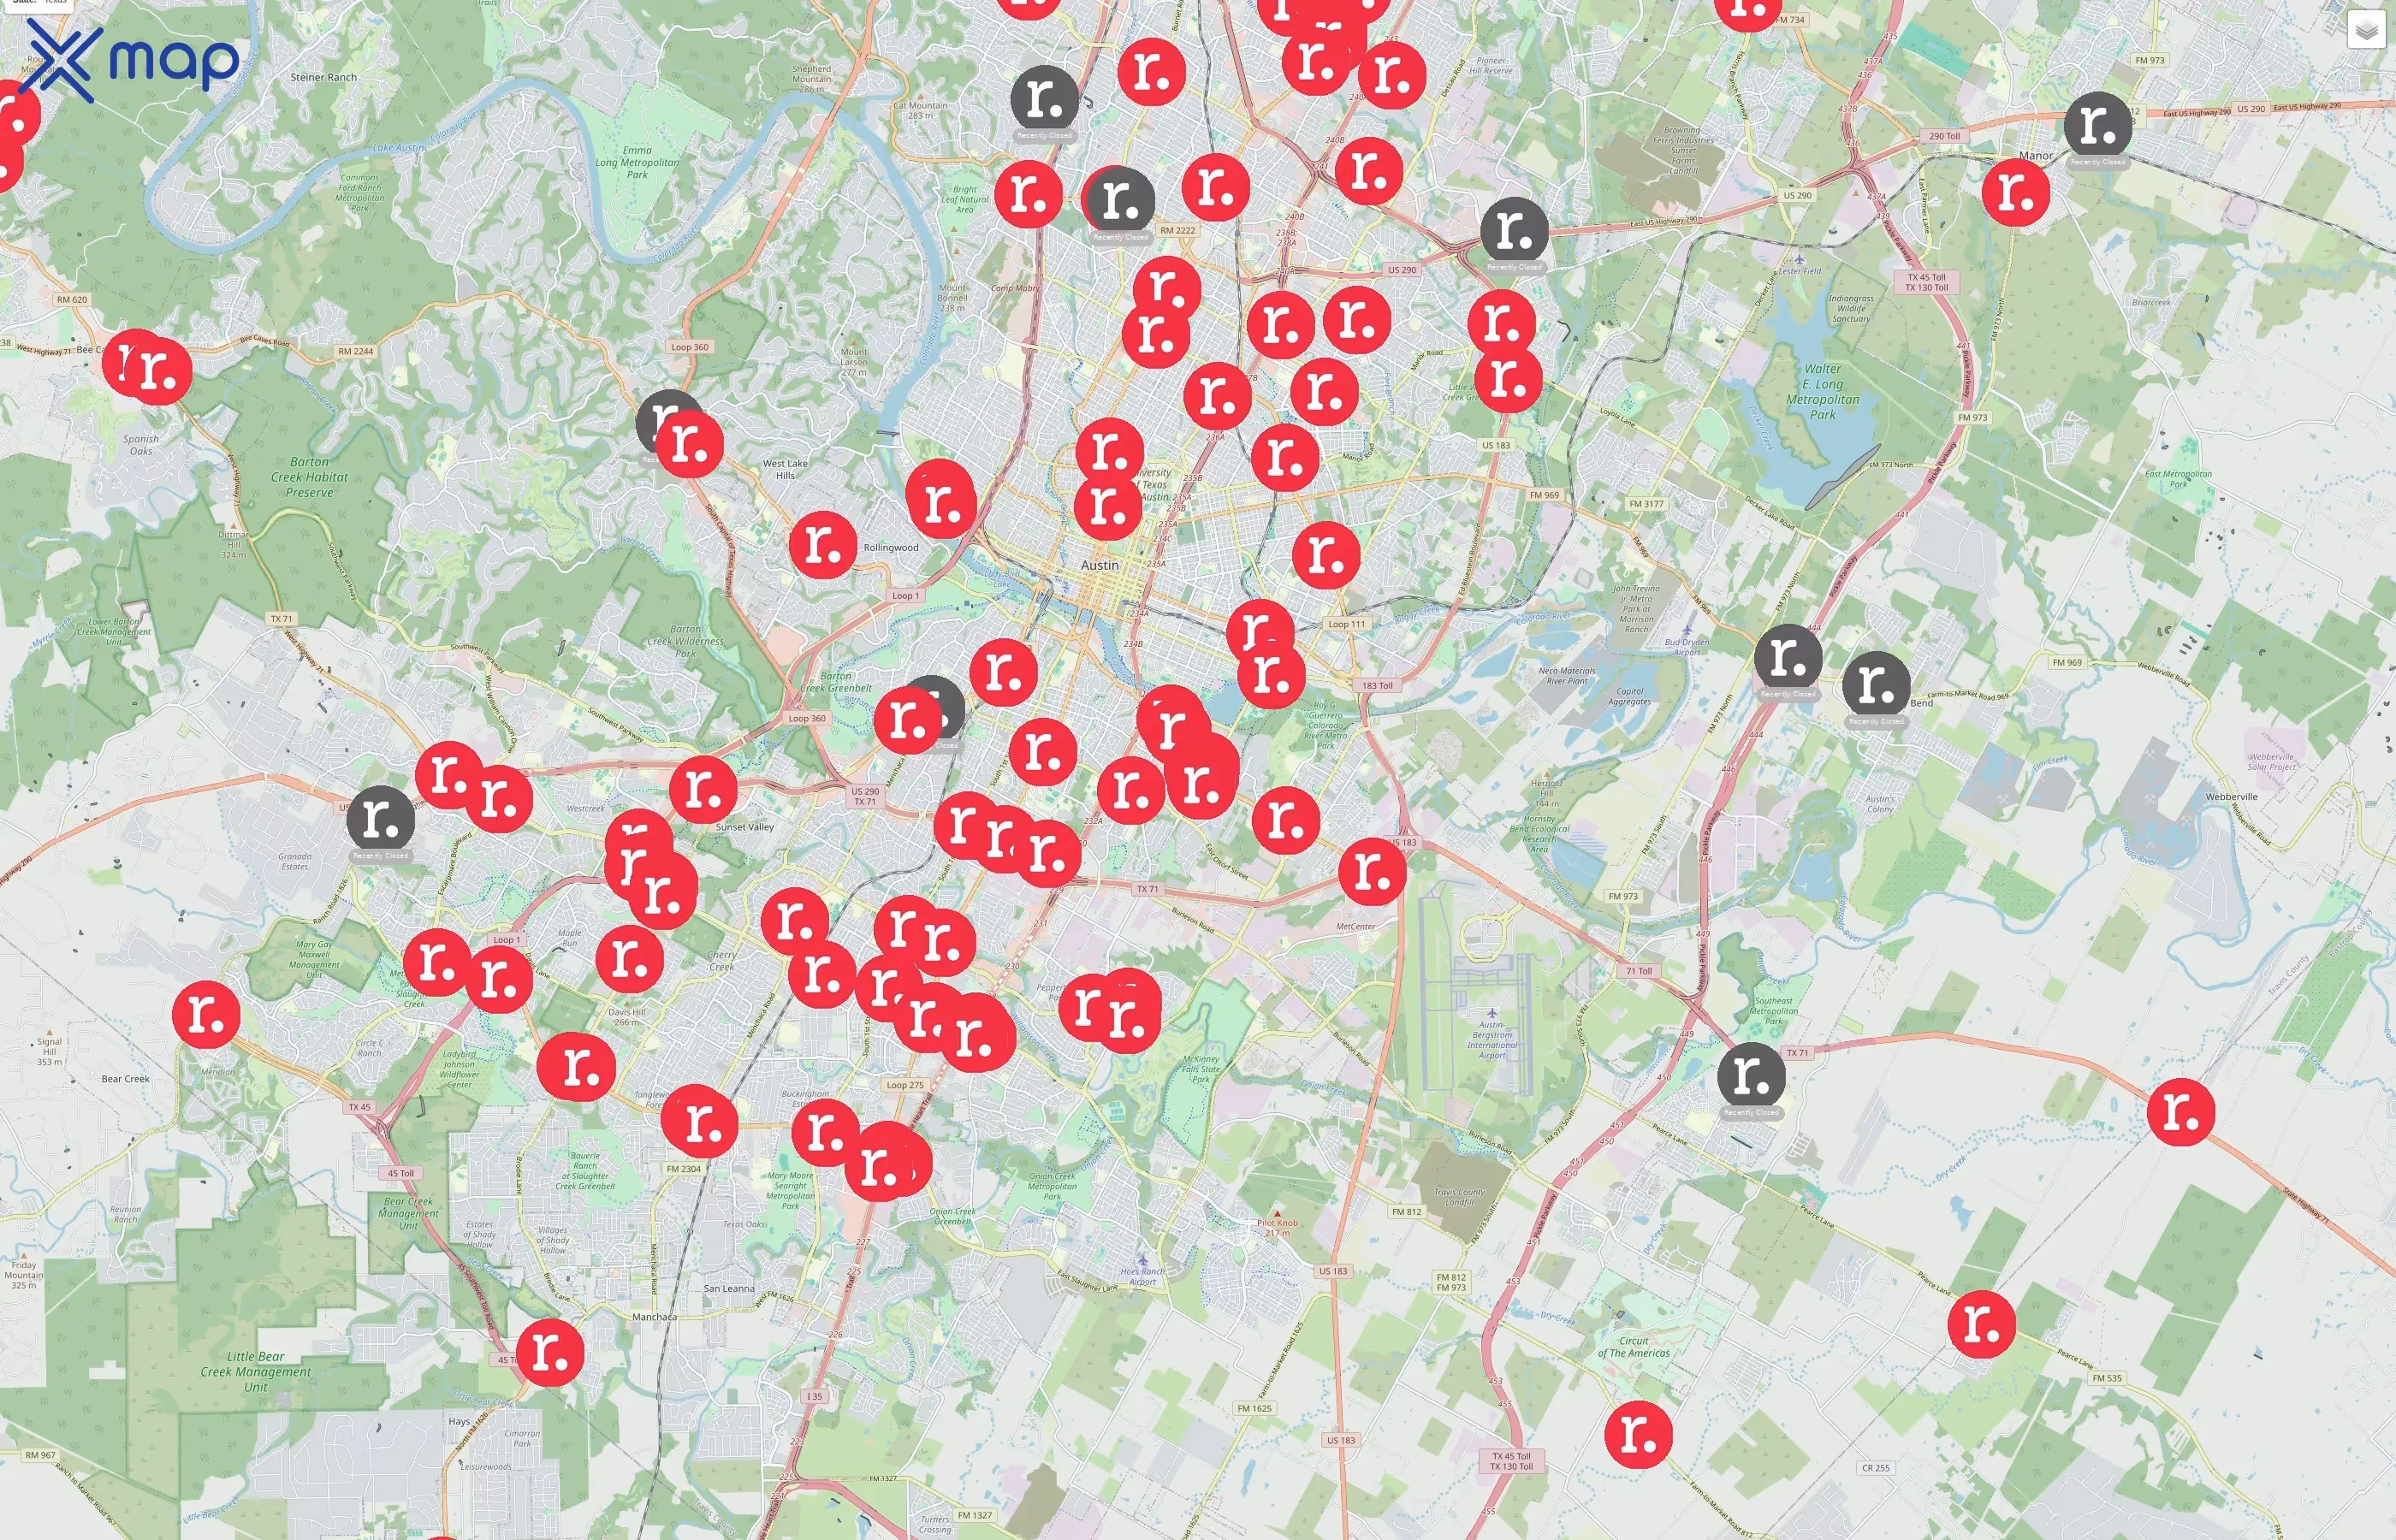
アメリカ合衆国でレッドボックスのロケーションが最も多い都市
場所は、ヒューストン、フェニックス、サンアントニオ、ロサンゼルス、シカゴなどの主要メトロに集中しています。上位 10 都市が米国のサイトの 5.3% を占めています。
ロケーション数でランク付けされた都市トップ10
レッドボックスは、米国全土に合計35,224か所の拠点を構えています。ロケーションの数が最も多い都市はテキサス州ヒューストンで、395 か所、アリゾナ州フェニックス(229 か所)がそれに続きます。上位 10 都市を合わせると、全国の Redbox の全拠点の 5.3% を占めています。テキサス州は、ヒューストン、サンアントニオ、ダラス、エルパソなど、トップ 10 に最も多くの都市がランクインしています。
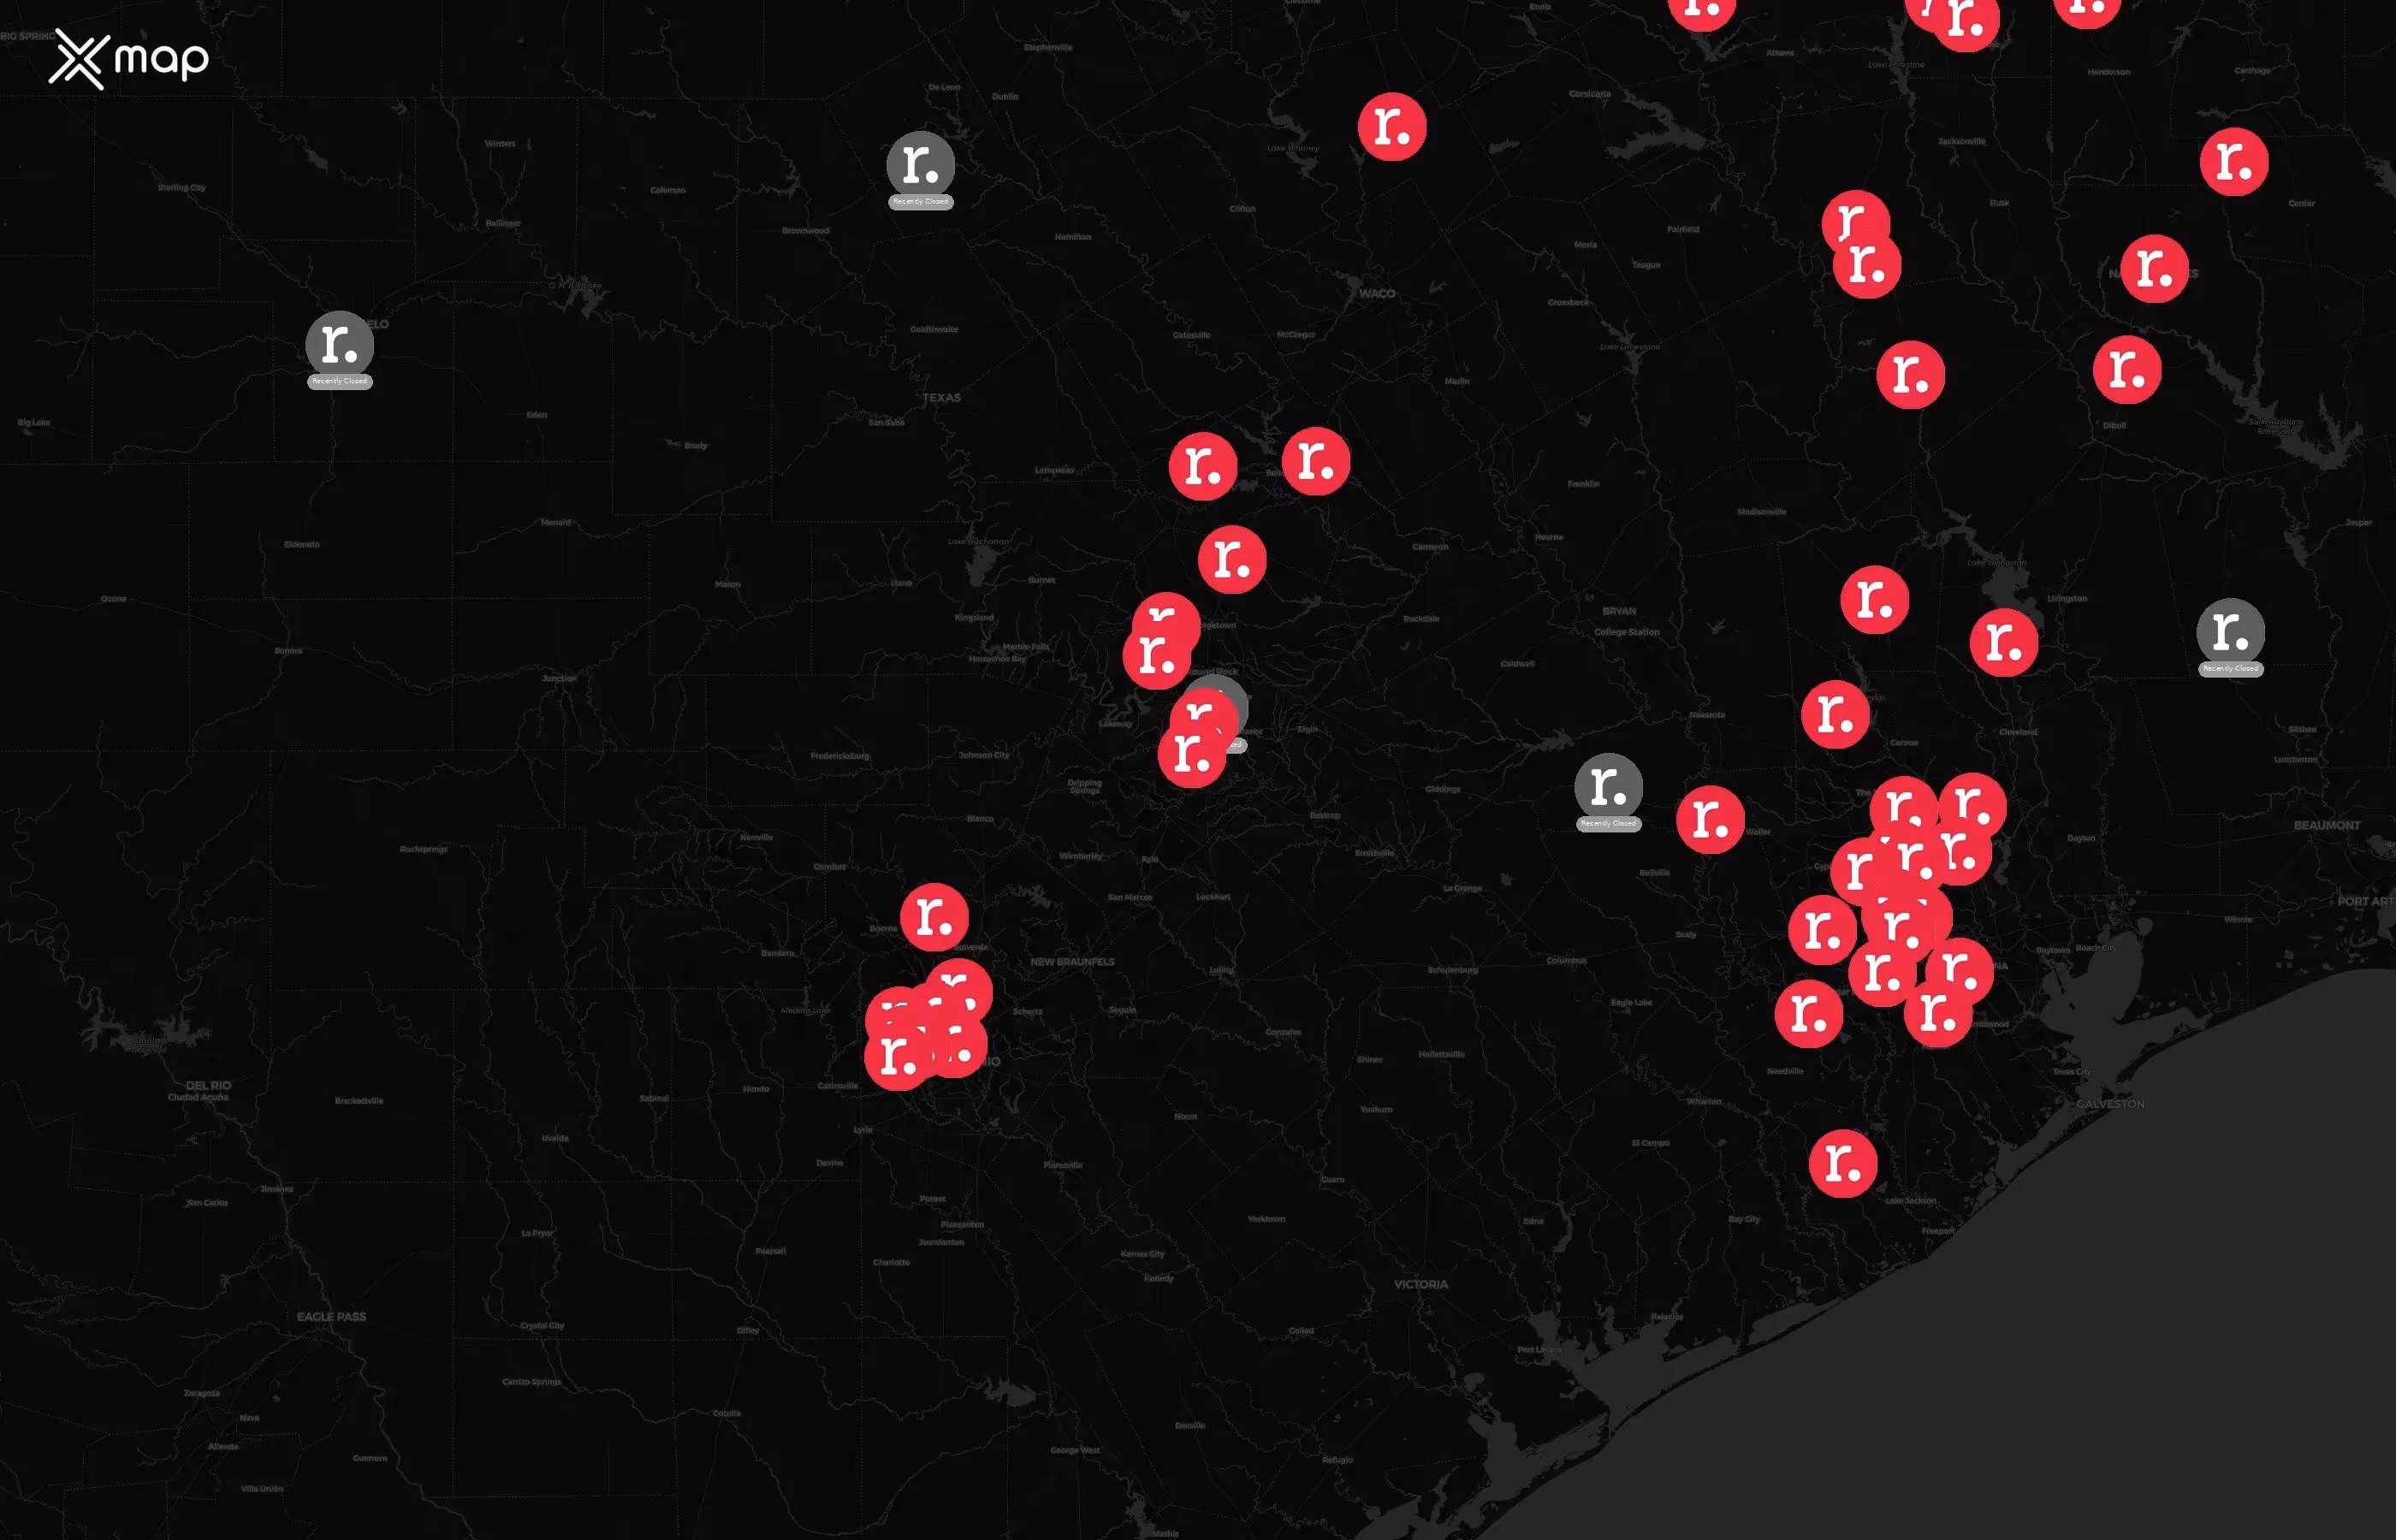
ストリートレベルのホットスポット (複数のレッドボックスがある最もにぎやかな通り)
ストリートレベルのクラスターは、同じ近傍内に複数のレッドボックスの場所がある廊下を示しており、地域的な存在感と一貫性が強いことを示しています。レッドボックスは全国で合計35224店舗を運営しています。
レッドボックスアウトレットのポイントオブインタレストデータをダウンロード
座標、交通パターン、運用状況など、米国全土のレッドボックスロケーションの完全なデータセットをダウンロードできます。
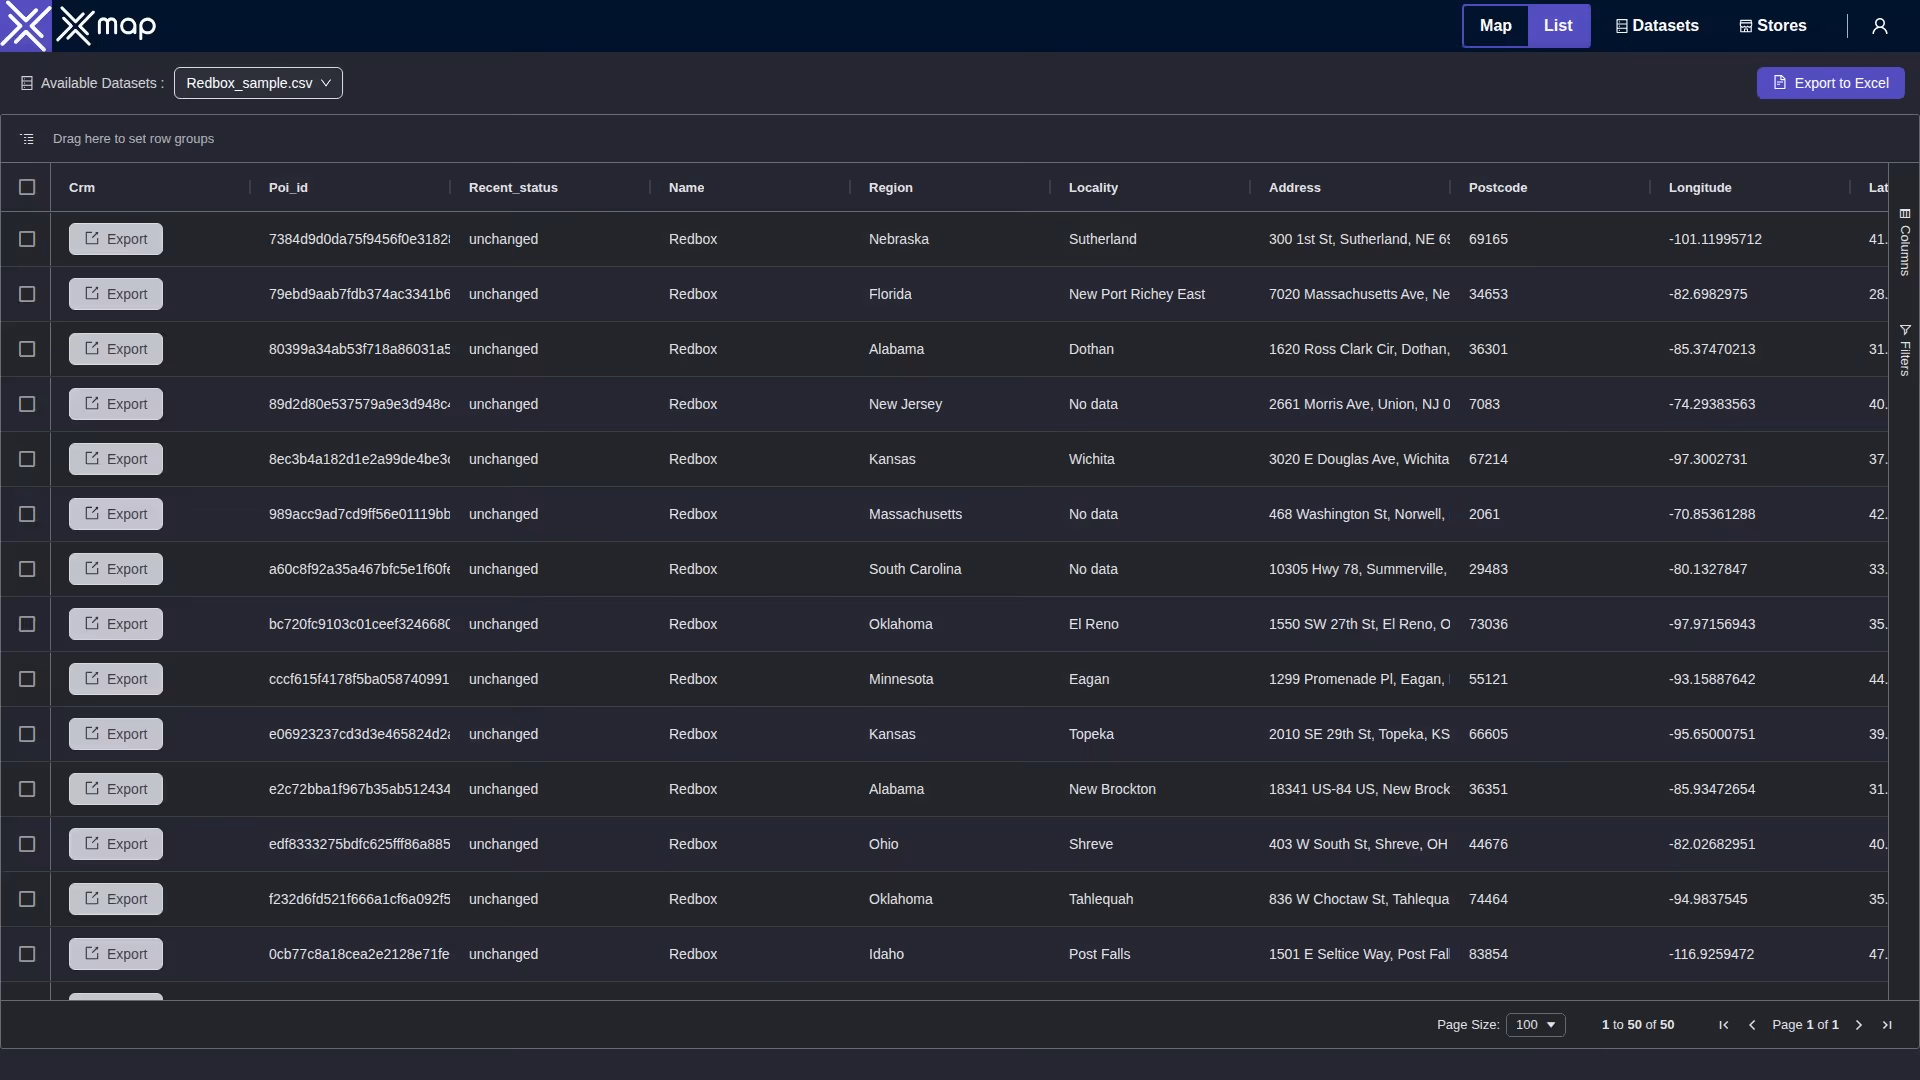
レッドボックス・ポイント・オブ・インタレストの主な変数
レッドボックスは、アメリカ合衆国全土に35224の拠点を構えています。主要な変数は、全国の Redbox ロケーションにとって最も影響の大きい側面を示しています。これにより、Redbox がさまざまな観点からどのように運営されているかが詳しくわかります。
レッドボックスロケーションごとの平均カバーエリア (州別)
米国内のレッドボックスロケーションは、土地面積が異なる複数の州に分散しています。掲載されている最大の州であるテキサス州は、面積が約 695,668 km² で、3,625 か所のレッドボックス拠点があります。一方、面積が上位の州の中で面積が最も小さいバージニア州は、約 110,786 km²、所在地が 1,138 か所あります。カリフォルニア州とフロリダ州はテキサス州に次いでそれぞれ423,965km²と184,934km²で、3,017か所と2,690か所を支えています。このデータは、地理的に広範囲に分散していることを浮き彫りにしており、ロケーション数は一般的に州の土地面積と相関関係にあります。
レッドボックスロケーションのビジネスステータス(オープンとクローズ)
米国のレッドボックスロケーションでは、オープンとクローズの比率が州ごとに異なります。開封率が最も高いのはアリゾナ州が 65.7% で、続いてテキサス州が 63.5% で、ペンシルベニア州が最も開封率が 34.1% と最も低くなっています。また、テキサス州は総店舗数が 3,625 件と最も多く、2,301 店舗がオープンしています。フロリダ州の報告によると、営業中の場所(1,039)よりも閉店した場所(1,625)の店舗の方が多く、開設率は 38.6% であることを反映しています。
レッドボックスロケーションの交通データ (州別)
このビューでは、各州のレッドボックスロケーション付近のアクティビティを比較しています。35,224 か所のサイトで観測されたトラフィックスコアを使用して、最も混雑する市場、平均以上のロケーションのシェアが高い州、およびアクティビティが比較的少ない地域が強調表示されます。パフォーマンスのベンチマークや現場業務の優先順位付け、事業拡大や最適化の機会の特定に活用してください。
上位 10 州のうち、混雑している Redbox のロケーションはどこですか?
Redboxは、テキサス州で最も混雑している場所の数が352か所と最も多く、合計3,625か所の9.7%に相当します。ジョージア州は 10.0% と最も高く、合計1,266か所のうち126か所を占めています。カリフォルニア州の混雑地域は 111 か所ありますが、混雑率は 3.7% と最も低くなっています。イリノイ州やアリゾナ州など他の州でも、繁忙地の割合はそれぞれ 9.5% と 9.3% 近くです。
Redboxロケーションのカスタマーレビューと評価
このセクションでは、Redbox に対するお客様の感想をまとめています。35,224 か所の評価とレビューの合計を使用して、スコアが一貫して高く、フィードバックの量が最も多い地域に焦点を当てます。星による平均評価は質の高さを反映し、レビュー総数はネットワーク全体でのエンゲージメントとリーチを示します。
平均評価
Redboxの最高平均評価は4.1で、アリゾナ州、フロリダ州、ジョージア州、イリノイ州、ノースカロライナ州で記録されています。レビュー数はテキサス州が6,921件で首位で、続いてカリフォルニアが5,832件、フロリダが5,072件となっています。ノースカロライナ州とジョージア州も、それぞれ 3,151 件と 2,925 件のレビューで大きく貢献しています。
レビュー数
Redboxは、アリゾナ州、フロリダ州、ジョージア州、イリノイ州、ノースカロライナ州で平均4.1という最高の評価を受けました。総レビュー数はテキサス州が6,921件でトップで、続いてカリフォルニアが5,832件、フロリダが5,072件でした。ノースカロライナ州とジョージア州もレビュー件数が多く、それぞれ 3,151 件と 2,925 件でした。
確認済みの連絡先情報が記載されたレッドボックスの場所
連絡先情報
Redboxは、全米のすべての上場州で電話を完全にカバーしました。テキサス州が3,625ユニットでリードし、カリフォルニアが3,017ユニット、フロリダ州が2,690ユニットでそれに続きます。各州の電話カバレッジ率は 100% で、これらの地域では Redbox が完全に接続されていることが分かりました。
レッドボックス・ポイント・オブ・インタレスト・データのユースケース
市場分析
Redbox POIデータにより、フットプリントと需要を明確に測定できます。アナリストは、州や都市を場所の数でランク付けし、対象地域を1人当たりの範囲で比較し、トラフィック・スコアとレビュー量を基に、パフォーマンスの高い市場やサービスの行き届いていない地域を特定できます。その結果、飽和状態、成長機会、業績外れ値を客観的に把握できます。
サイト選択
ネットワーク計画では、このデータは、立地密度、場所ごとの人口、および近隣の交通量を使用して候補商圏をスコアリングするのに役立ちます。チームは、店舗から最も近い距離から競合リスクを評価したり、主要な通路に沿って空白を浮き彫りにしたり、観察された活動が最も活発な小売店街、キャンパス、交通機関に近い場所に優先順位を付けたりできます。
都市計画
計画担当者は、クラスターとサービスギャップをマッピングして、近隣レベルでの商業アクセスを把握できます。一人当たりの調査ではアクセスが制限されているコミュニティが強調され、開館や閉鎖の変化は活動の変化を示唆しています。これらの洞察は、回廊の活性化、街並みと交通計画、データ主導のゾーニングの決定に役立ちます。
このxMapのPOIデータは企業にどのように役立ちますか?
- 精度と精度: xMap データは精度の高いデータを提供するため、欠陥のある情報に基づいて誤った判断を下す可能性が最小限に抑えられます。
- 完全なデータ: xMapを使用すると、企業は包括的で完全なデータにアクセスできるため、知識のギャップを効果的に埋め、意思決定のための包括的なビューを提供できます。
- 最新情報: xMapは、提供されたデータが定期的に更新されることを保証します。これにより、企業は現在の傾向や状況に合わせて、動的でタイムリーな意思決定を行うことができます。
- スケーラビリティ: xMap データは、さまざまな事業規模や要件に対応するインサイトを提供することで、事業を効率的に拡大することができます。
- 分析力: xMapデータの分析を活用することで、パターンや傾向を特定できるため、企業の戦略的計画と予測が強化されます。
Redbox ポイントオブインタレストデータをダウンロード

アメリカ合衆国におけるレッドボックスの拠点数
