アメリカ合衆国におけるポパイズ・ルイジアナ・キッチンの店舗数
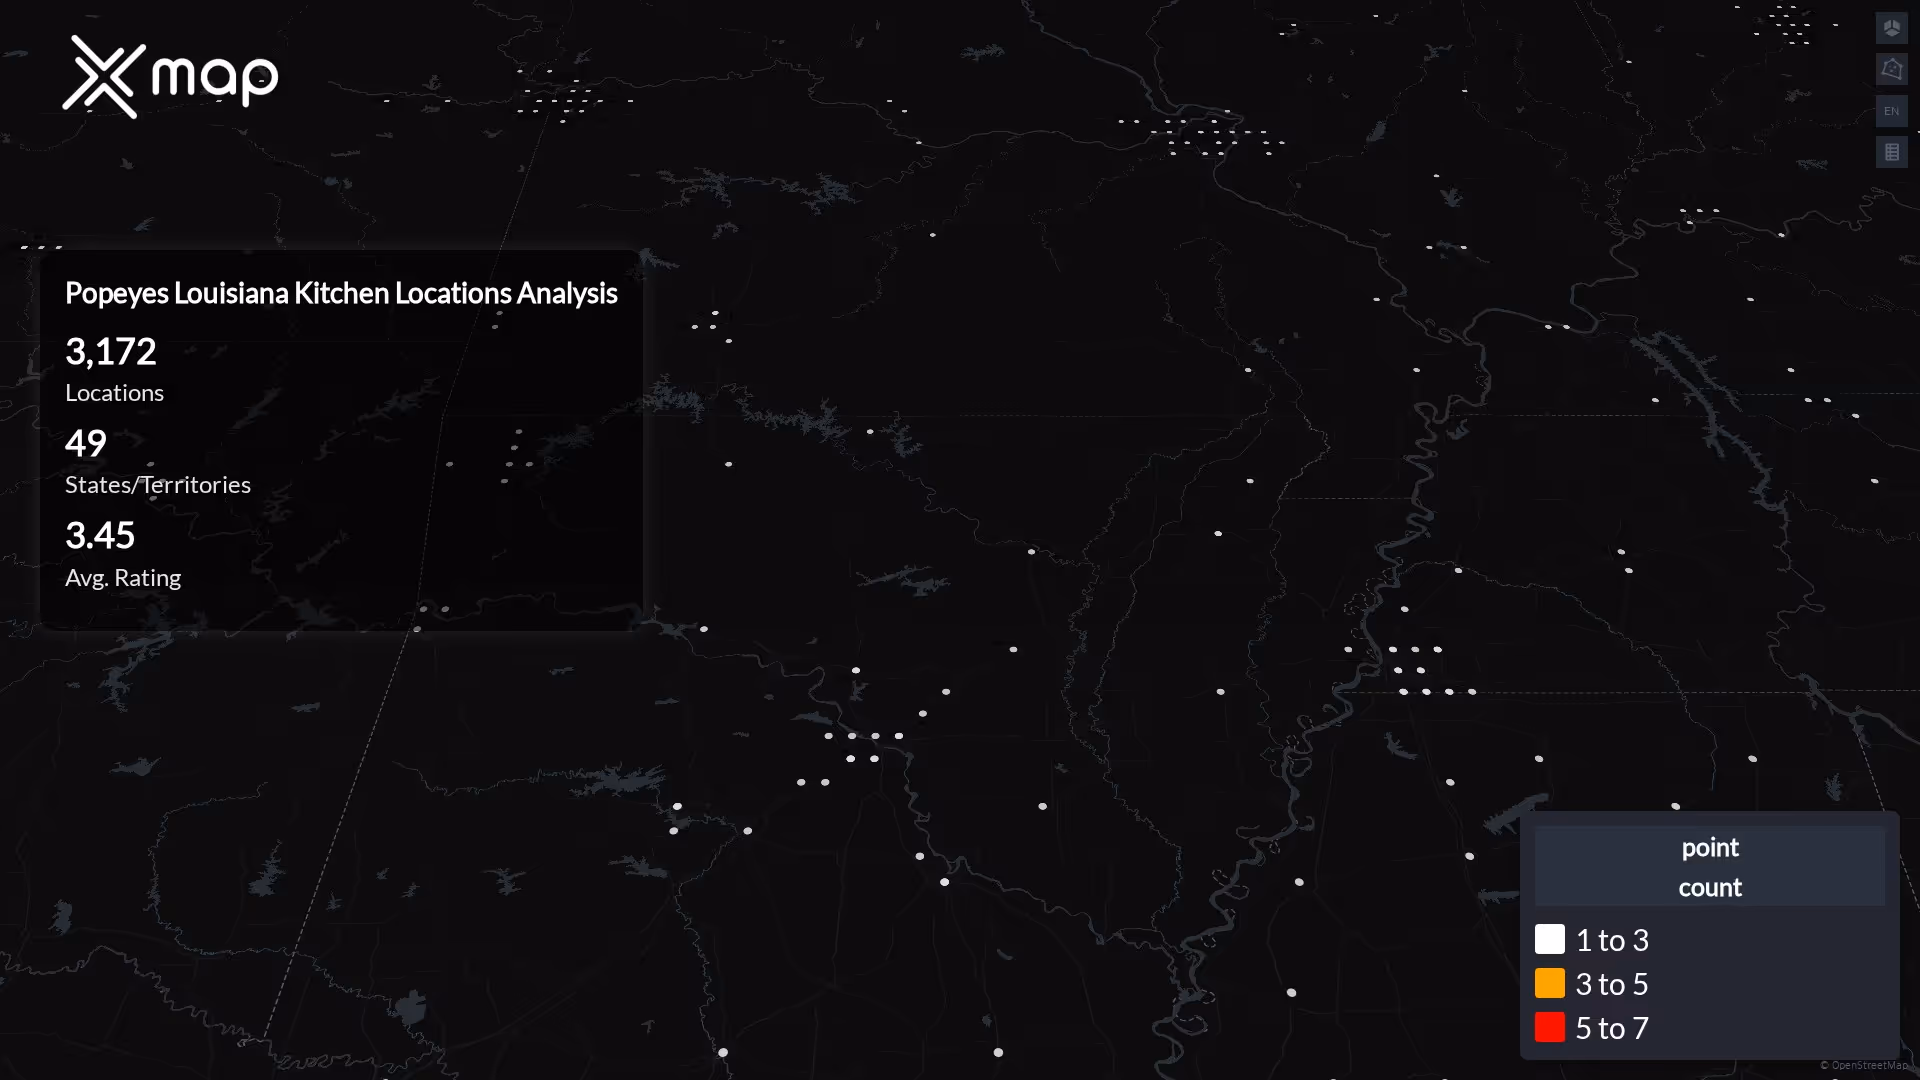
2025年11月17日現在、アメリカ合衆国には3,172のポパイズルイジアナキッチン店舗があります。ポパイズ・ルイジアナ・キッチンの店舗数が最も多い州または準州はテキサス州で、430の拠点があり、全体の約 13.6% を占めています。

ポパイズ・ルイジアナ・キッチンはアメリカにいくつありますか?

3,172

3,170

3,172

3,172

0
アメリカ合衆国全土の州別のポパイズ・ルイジアナ・キッチンの店舗の分布
ポパイズ・ルイジアナ・キッチンは、米国49州に3,172店舗を展開しています。最大のクラスターはテキサス州、カリフォルニア州、ニューヨーク州で、上位 10 州には 61.5% のサイトが含まれています。ノースダコタ州、サウスダコタ州、モンタナ州では対象範囲が狭くなっています。

アメリカ合衆国でポパイズ・ルイジアナ・キッチンの店舗数が最も多い州トップ10
Popeyes Louisiana Kitchenは訪問者のエンゲージメントが強く、平均トラフィックスコア(平均:57.38)を上回り、425か所が高訪問者数として認定されています。
ポパイズ・ルイジアナ・キッチンは全米に3,172店舗を構え、テキサス州が430か所(全体の13.6%)でリードし、カリフォルニア州(280か所)とニューヨーク州(239か所)がそれに続き、合計で全店舗の29.9%を占めています。上位10州がブランドの存在感の 61.5% を占めています。ルイジアナ州は 30,530 人につき 1 店舗という最もアクセスが良く、モンタナ州は居住者 545,920 人につき 1 店舗という最も広い地域です。
ポパイズ・ルイジアナ・キッチン一人当たりのインサイト
- ポパイズ・ルイジアナ・キッチンへの一人当たりのアクセスが一番良いのは州(ルイジアナ州、ミシシッピ州、メリーランド州)です。
- カリフォルニア州、ニューヨーク州、フロリダ州、ニュージャージー州、バージニア州などの州は、多数の拠点があるにもかかわらず、一人当たりのサービスが行き届いておらず、郊外への拡張需要が見込まれています。
- いくつかの州では、人口増加とポパイズ・ルイジアナ・キッチンの密度のバランスが取れており、競争が続くホットスポットとなっています。
アメリカ合衆国でポパイズ・ルイジアナ・キッチンの店舗数が最も多い都市
場所は、ハリス、クック、ロサンゼルス、キングス、クイーンズなどの主要メトロに集中しています。米国のサイトの 16.6% は上位 10 都市が占めています。

ロケーション数でランク付けされた都市トップ10
ポパイズ・ルイジアナ・キッチンは、全米に合計3,172の店舗を構えています。店舗数で上位の都市はテキサス州ハリスで、108店舗あり、続いてイリノイ州クックが79店舗です。上位10都市を合わせると全店舗の 16.6% を占めており、特定の都市部にかなり集中していることが浮き彫りになります。
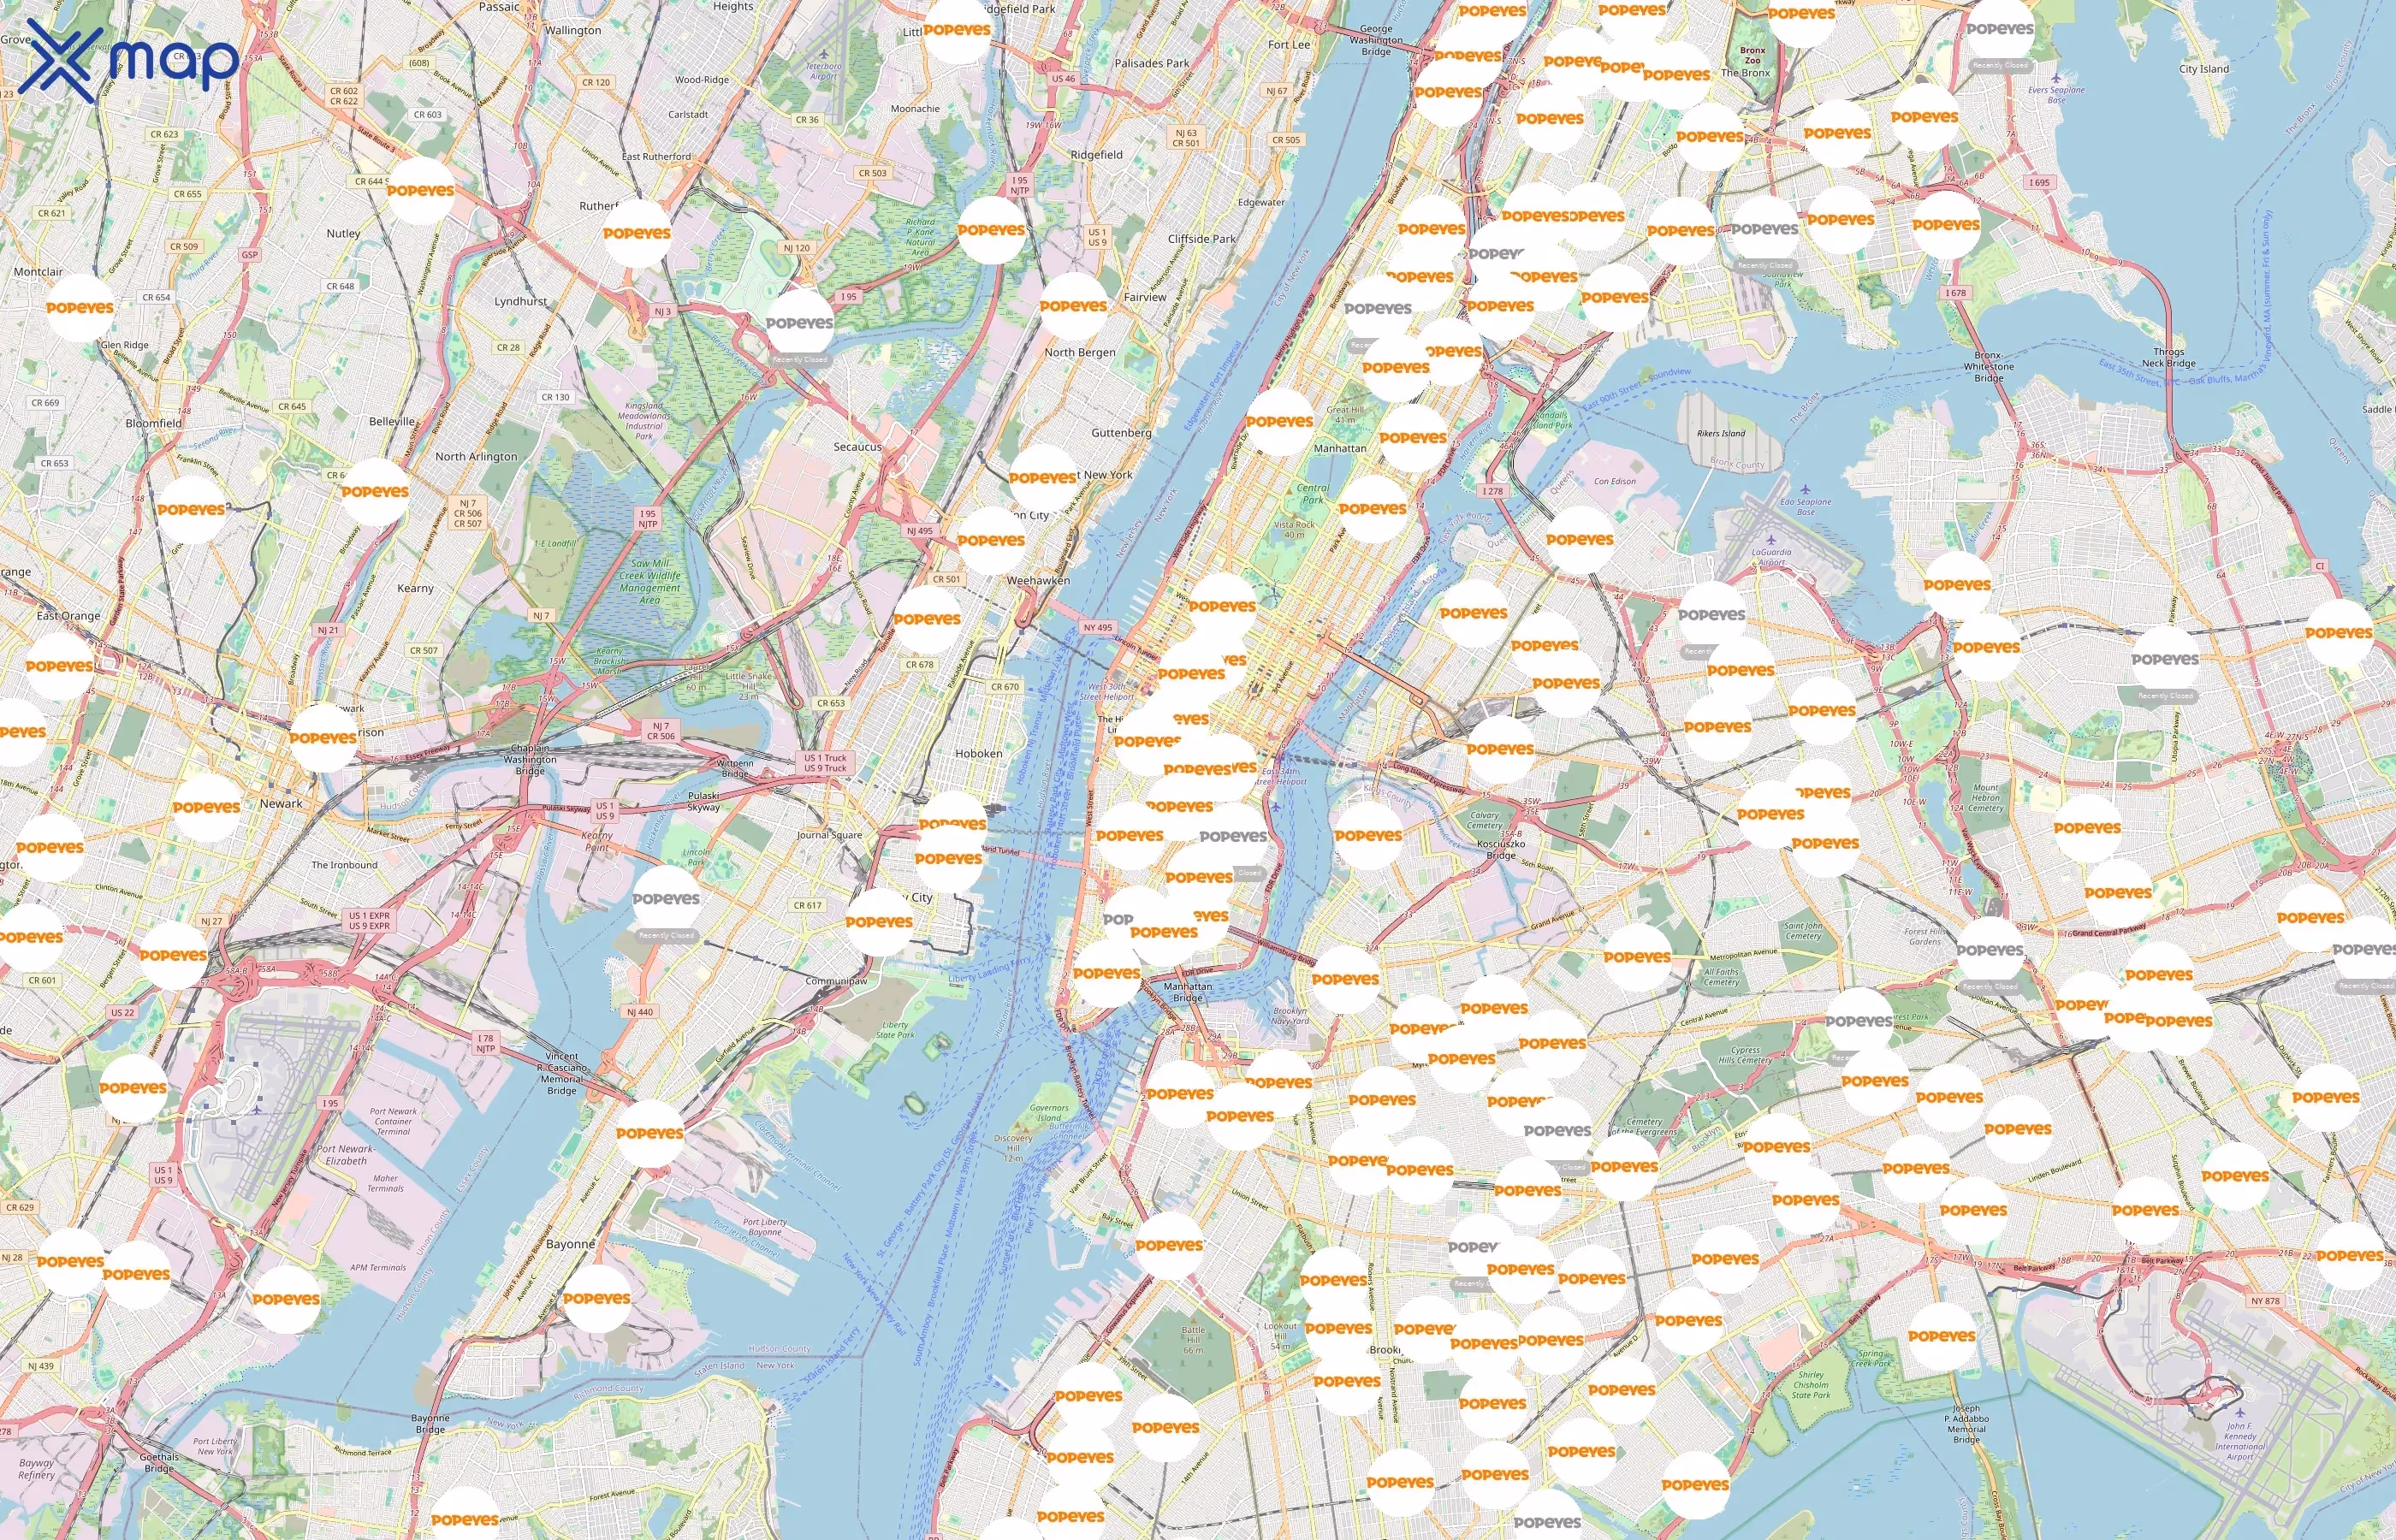
ストリートレベルのホットスポット(ポパイズ・ルイジアナ・キッチンが複数ある最もにぎやかな通り)
街路レベルのクラスターを見ると、同じ地域内にポパイズ・ルイジアナ・キッチンの複数の店舗が立ち並ぶ廊下が見られます。これは、地域的な存在感と一貫性が強いことを示しています。ポパイズ・ルイジアナ・キッチンは、全国で合計3172店舗を運営しています。

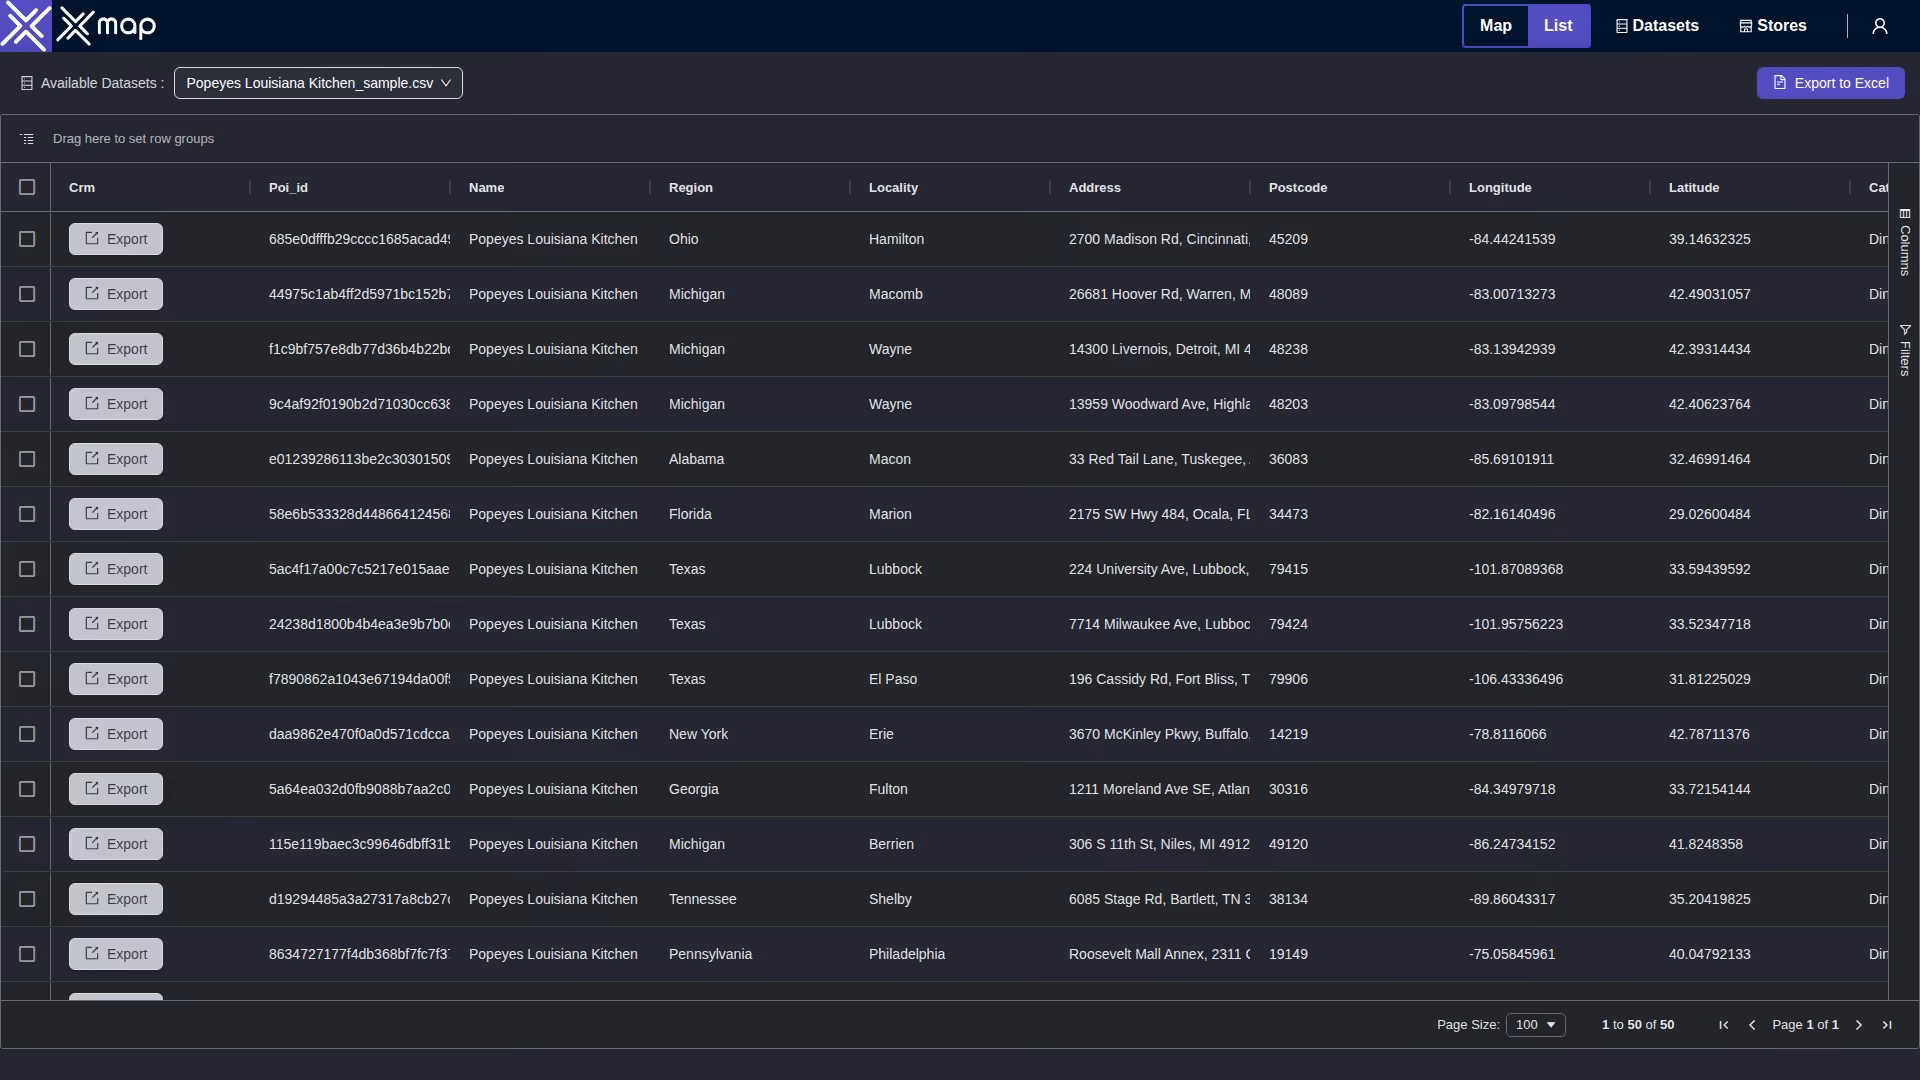
ポパイズ・ルイジアナ・キッチン・アウトレット・ポイント・オブ・インタレスト・データをダウンロード
座標、交通パターン、運用状況など、アメリカ合衆国全土のポパイズ・ルイジアナ・キッチンの所在地の完全なデータセットをダウンロードできます。
ポパイズ・ルイジアナ・キッチンの見どころの主な変数
ポパイズルイジアナキッチンは、アメリカ合衆国全土に3172店舗を構えています。主な変数は、全国のポパイズ・ルイジアナ・キッチンの店舗で最も影響の大きかった側面を示しています。これにより、ポパイズ・ルイジアナ・キッチンがさまざまな観点からどのように運営されているかが詳しくわかります。
ルイジアナ州ポパイズのキッチン拠点ごとの平均カバー面積(州別)
ポパイズルイジアナキッチンは、米国内のさまざまな州に分散しており、土地面積もさまざまです。テキサス州は約695,668km²と記載されている最大の州で、州内で最も多い430の店舗があります。対照的に、陸地面積が約22,583km²と最も小さい州であるニュージャージー州には、108の州があります。その他の注目すべき州には、テキサス州に比べて土地面積が小さいにもかかわらず、280 か所のカリフォルニア州、239 か所のニューヨーク州があります。
ポパイズ・ルイジアナ・キッチン店舗の事業状況(オープンとクローズ)

ポパイズルイジアナキッチンは米国で強い存在感を示しており、テキサス(430)、フロリダ(218)、ジョージア(160)、ルイジアナ(160)、ルイジアナ(152)、ニュージャージー(108)、メリーランド(107)、バージニア(101)などの州にすべての店舗をオープンしています。カリフォルニア州、ニューヨーク州、イリノイ州の営業率はほぼ完成しており、オープン率はそれぞれ 99.6%、99.2%、99.4% です。全体として、このブランドは上位の州全体で非常に高い出店率を維持しています。
ポパイズ・ルイジアナ・キッチン店舗の交通データ(州別)
このビューでは、ポパイズ・ルイジアナ・キッチン周辺のアクティビティを州全体で比較しています。3,172 か所のサイト付近で観測されたトラフィックスコアを使用して、最も混雑する市場、平均以上のロケーションのシェアが高い州、およびアクティビティが比較的少ない地域が強調されています。パフォーマンスのベンチマーキング、現場業務の優先順位付け、事業拡大や最適化の機会の特定に活用してください。

ポパイズ・ルイジアナ・キッチンの上位10州の中で、混雑しているのはどの店舗ですか?
ポパイズ・ルイジアナ・キッチンは、テキサス州で最も忙しい店舗の数が最も多く、430店舗のうち104店舗(24.2%)を占めています。ルイジアナ州は 27.0% と最も混雑している店舗の割合が最も高く、合計152か所のうち41店舗が混雑しています。カリフォルニア、ニューヨーク、フロリダはそれぞれ 20% 以上の拠点が混雑しており、カリフォルニアは 24.3%(68/280)、ニューヨークは 23.8%(57/239)、フロリダ州は 23.4%(51/2 18)となっています。ジョージア州、イリノイ州、ニュージャージー州、メリーランド州、バージニア州などの他の州では、混雑地域の割合は 23.1% から 23.8% の範囲です。
ポパイズルイジアナキッチンロケーションのカスタマーレビューと評価
このセクションでは、ポパイズルイジアナキッチンに対するお客様の声をまとめています。3,172 か所の評価とレビューの合計を使用して、スコアが一貫して高く、フィードバックの量が最も多い場所に焦点を当てます。星による平均評価は質の高さを反映し、レビュー総数はネットワーク全体でのエンゲージメントとリーチを示します。
平均評価
ポパイズ・ルイジアナ・キッチンの平均評価はルイジアナ州で3.7と最も高く、続いてカリフォルニア、ニュージャージー、ニューヨークが続き、それぞれ平均評価が3.6です。メリーランド州も平均評価が3.5と上位にランクされています。レビュー数はテキサス州が386,794件でトップで、フロリダ州とカリフォルニア州がそれぞれ267,009件と241,324件でそれに続きます。
レビュー数
ポパイズ・ルイジアナ・キッチンの平均評価はルイジアナ州で3.7と最も高く、続いてカリフォルニア、ニュージャージー、ニューヨークが続き、それぞれ平均評価が3.6です。テキサス州のレビュー総数は386,794件でトップで、フロリダ州の267,009件とカリフォルニア州の241,324件を大幅に上回っています。ジョージア州とニューヨーク州もレビュー数が多く、それぞれ 158,429 件と 150,241 件です。
確認済みの連絡先情報があるポパイズルイジアナキッチンの場所
連絡先情報
Popeyes Louisiana Kitchenは、リストされている上位10州のすべての店舗で電話を完全にカバーしています。テキサス州が 430 か所で、次いでカリフォルニアが 280 か所、ニューヨークが 239 か所で、それぞれ 100% の電話対応状況です。フロリダ州、ジョージア州、イリノイ州などの他の州でも、それぞれ 218 か所、160 か所、155 か所で完全な電話カバレッジを維持しています。この一貫した 100% の電話プレゼンスは、表示されている 10 州すべてに及んでいます。
ポパイズルイジアナキッチンポイントオブインタレストデータのユースケース
市場分析
ポパイズルイジアナキッチンのPOIデータにより、フットプリントと需要を明確に測定できます。アナリストは、州や都市をロケーション数でランク付けしたり、1 人あたりの対象範囲を比較したり、トラフィックスコアやレビュー量を活用してパフォーマンスの高い市場やサービスの行き届いていない地域を特定したりできます。その結果、飽和状態、成長機会、業績外れ値を客観的に把握できます。
サイト選択
ネットワーク計画では、このデータは、立地密度、場所ごとの人口、および近隣の交通量を使用して候補商圏をスコアリングするのに役立ちます。チームは、店舗から最も近い距離から競合リスクを評価したり、主要な通路に沿って空白を浮き彫りにしたり、観察された活動が最も活発な小売店街、キャンパス、交通機関に近い場所に優先順位を付けたりできます。
都市計画
計画担当者は、クラスターとサービスギャップをマッピングして、近隣レベルでの商業アクセスを把握できます。一人当たりの調査ではアクセスが制限されているコミュニティが強調され、開館や閉鎖の変化は活動の変化を示唆しています。これらの洞察は、回廊の活性化、街並みと交通計画、データ主導のゾーニングの決定に役立ちます。
このxMapのPOIデータは企業にどのように役立ちますか?
- 精度と精度: xMap データは精度の高いデータを提供するため、欠陥のある情報に基づいて誤った判断を下す可能性が最小限に抑えられます。
- 完全なデータ: xMapを使用すると、企業は包括的で完全なデータにアクセスできるため、知識のギャップを効果的に埋め、意思決定のための包括的なビューを提供できます。
- 最新情報: xMapは、提供されたデータが定期的に更新されることを保証します。これにより、企業は現在の傾向や状況に合わせて、動的でタイムリーな意思決定を行うことができます。
- スケーラビリティ: xMap データは、さまざまな事業規模や要件に対応するインサイトを提供することで、事業を効率的に拡大することができます。
- 分析力: xMapデータの分析を活用することで、パターンや傾向を特定できるため、企業の戦略的計画と予測が強化されます。
ポパイズ・ルイジアナ・キッチンのポイント・オブ・インタレスト・データをダウンロード

アメリカ合衆国におけるポパイズ・ルイジアナ・キッチンの店舗数
