アメリカ合衆国のハント・ブラザーズ・ピザ店の数
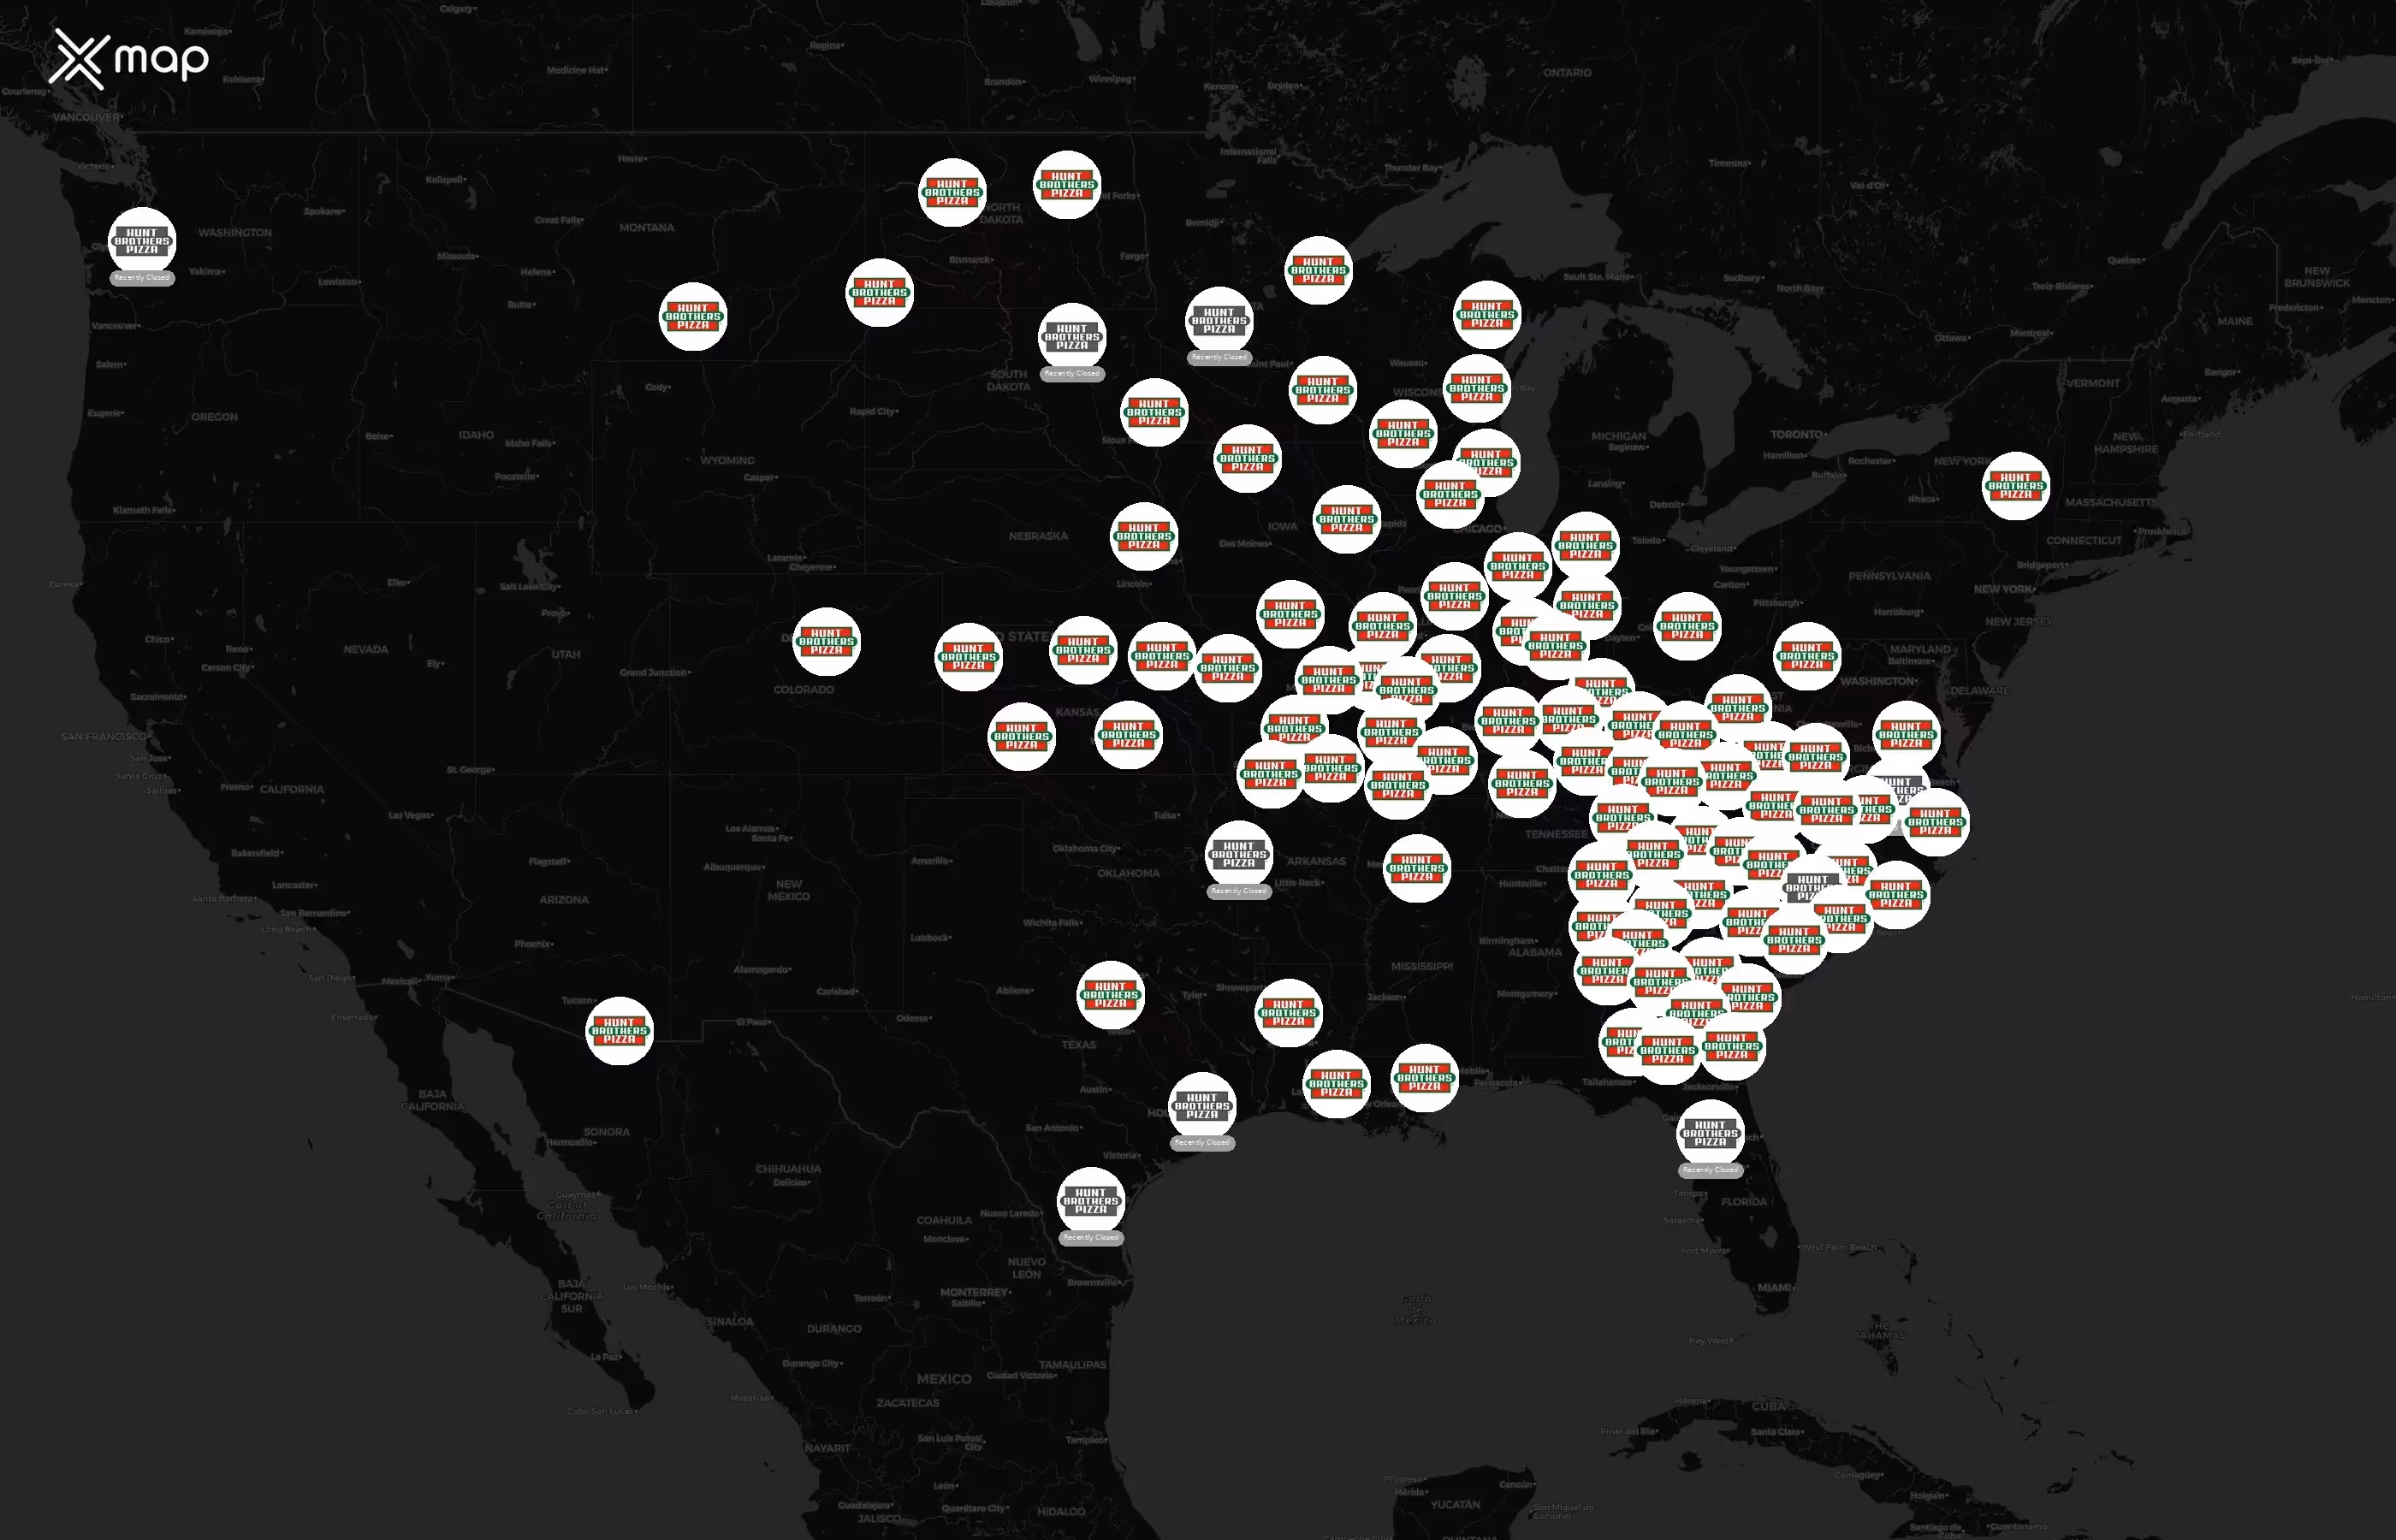
2025年11月17日現在、アメリカ合衆国には3,952店舗のハント・ブラザーズ・ピザ店があります。ハント・ブラザーズ・ピザの店舗数が最も多い州または準州はジョージア州で、店舗数は857店舗で、全体の約 21.7% を占めています。
アメリカにはハント・ブラザーズ・ピザがいくつありますか?
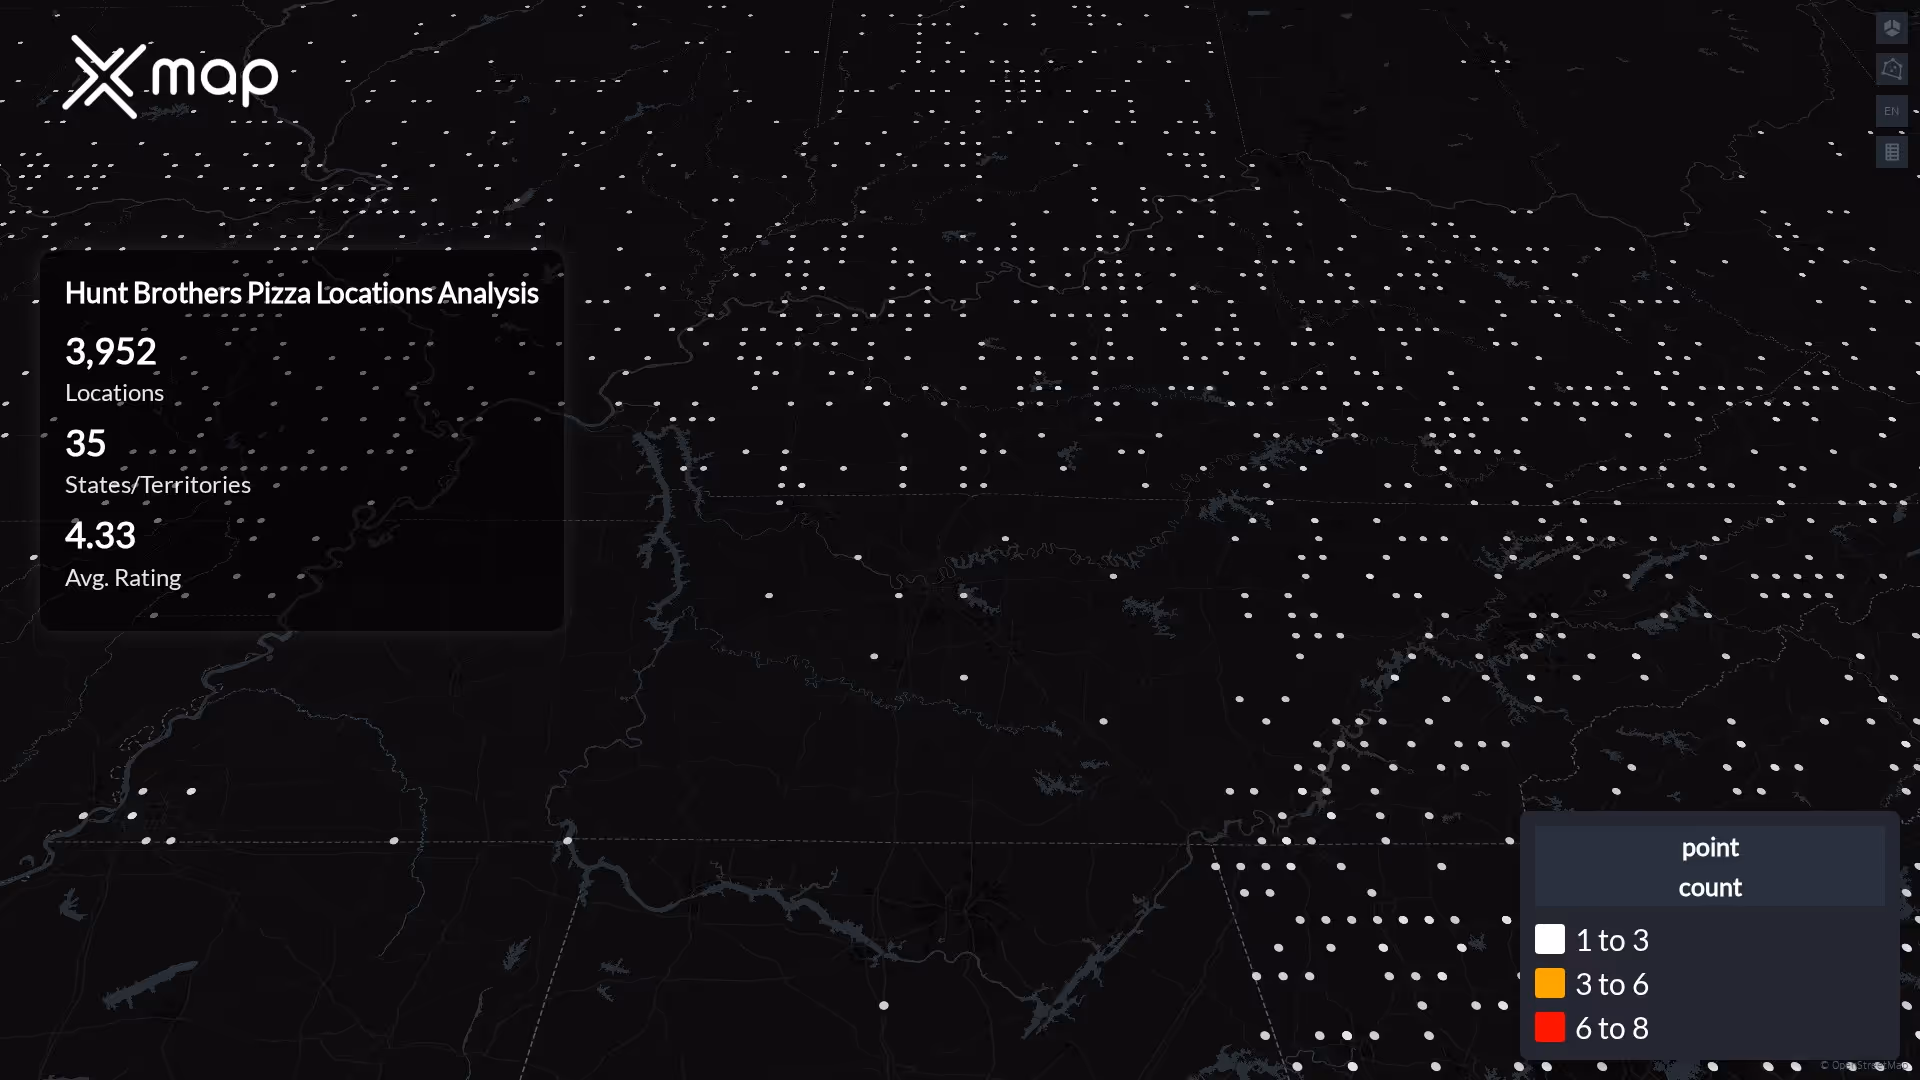

3,952

1,722

3,952

3,952

0
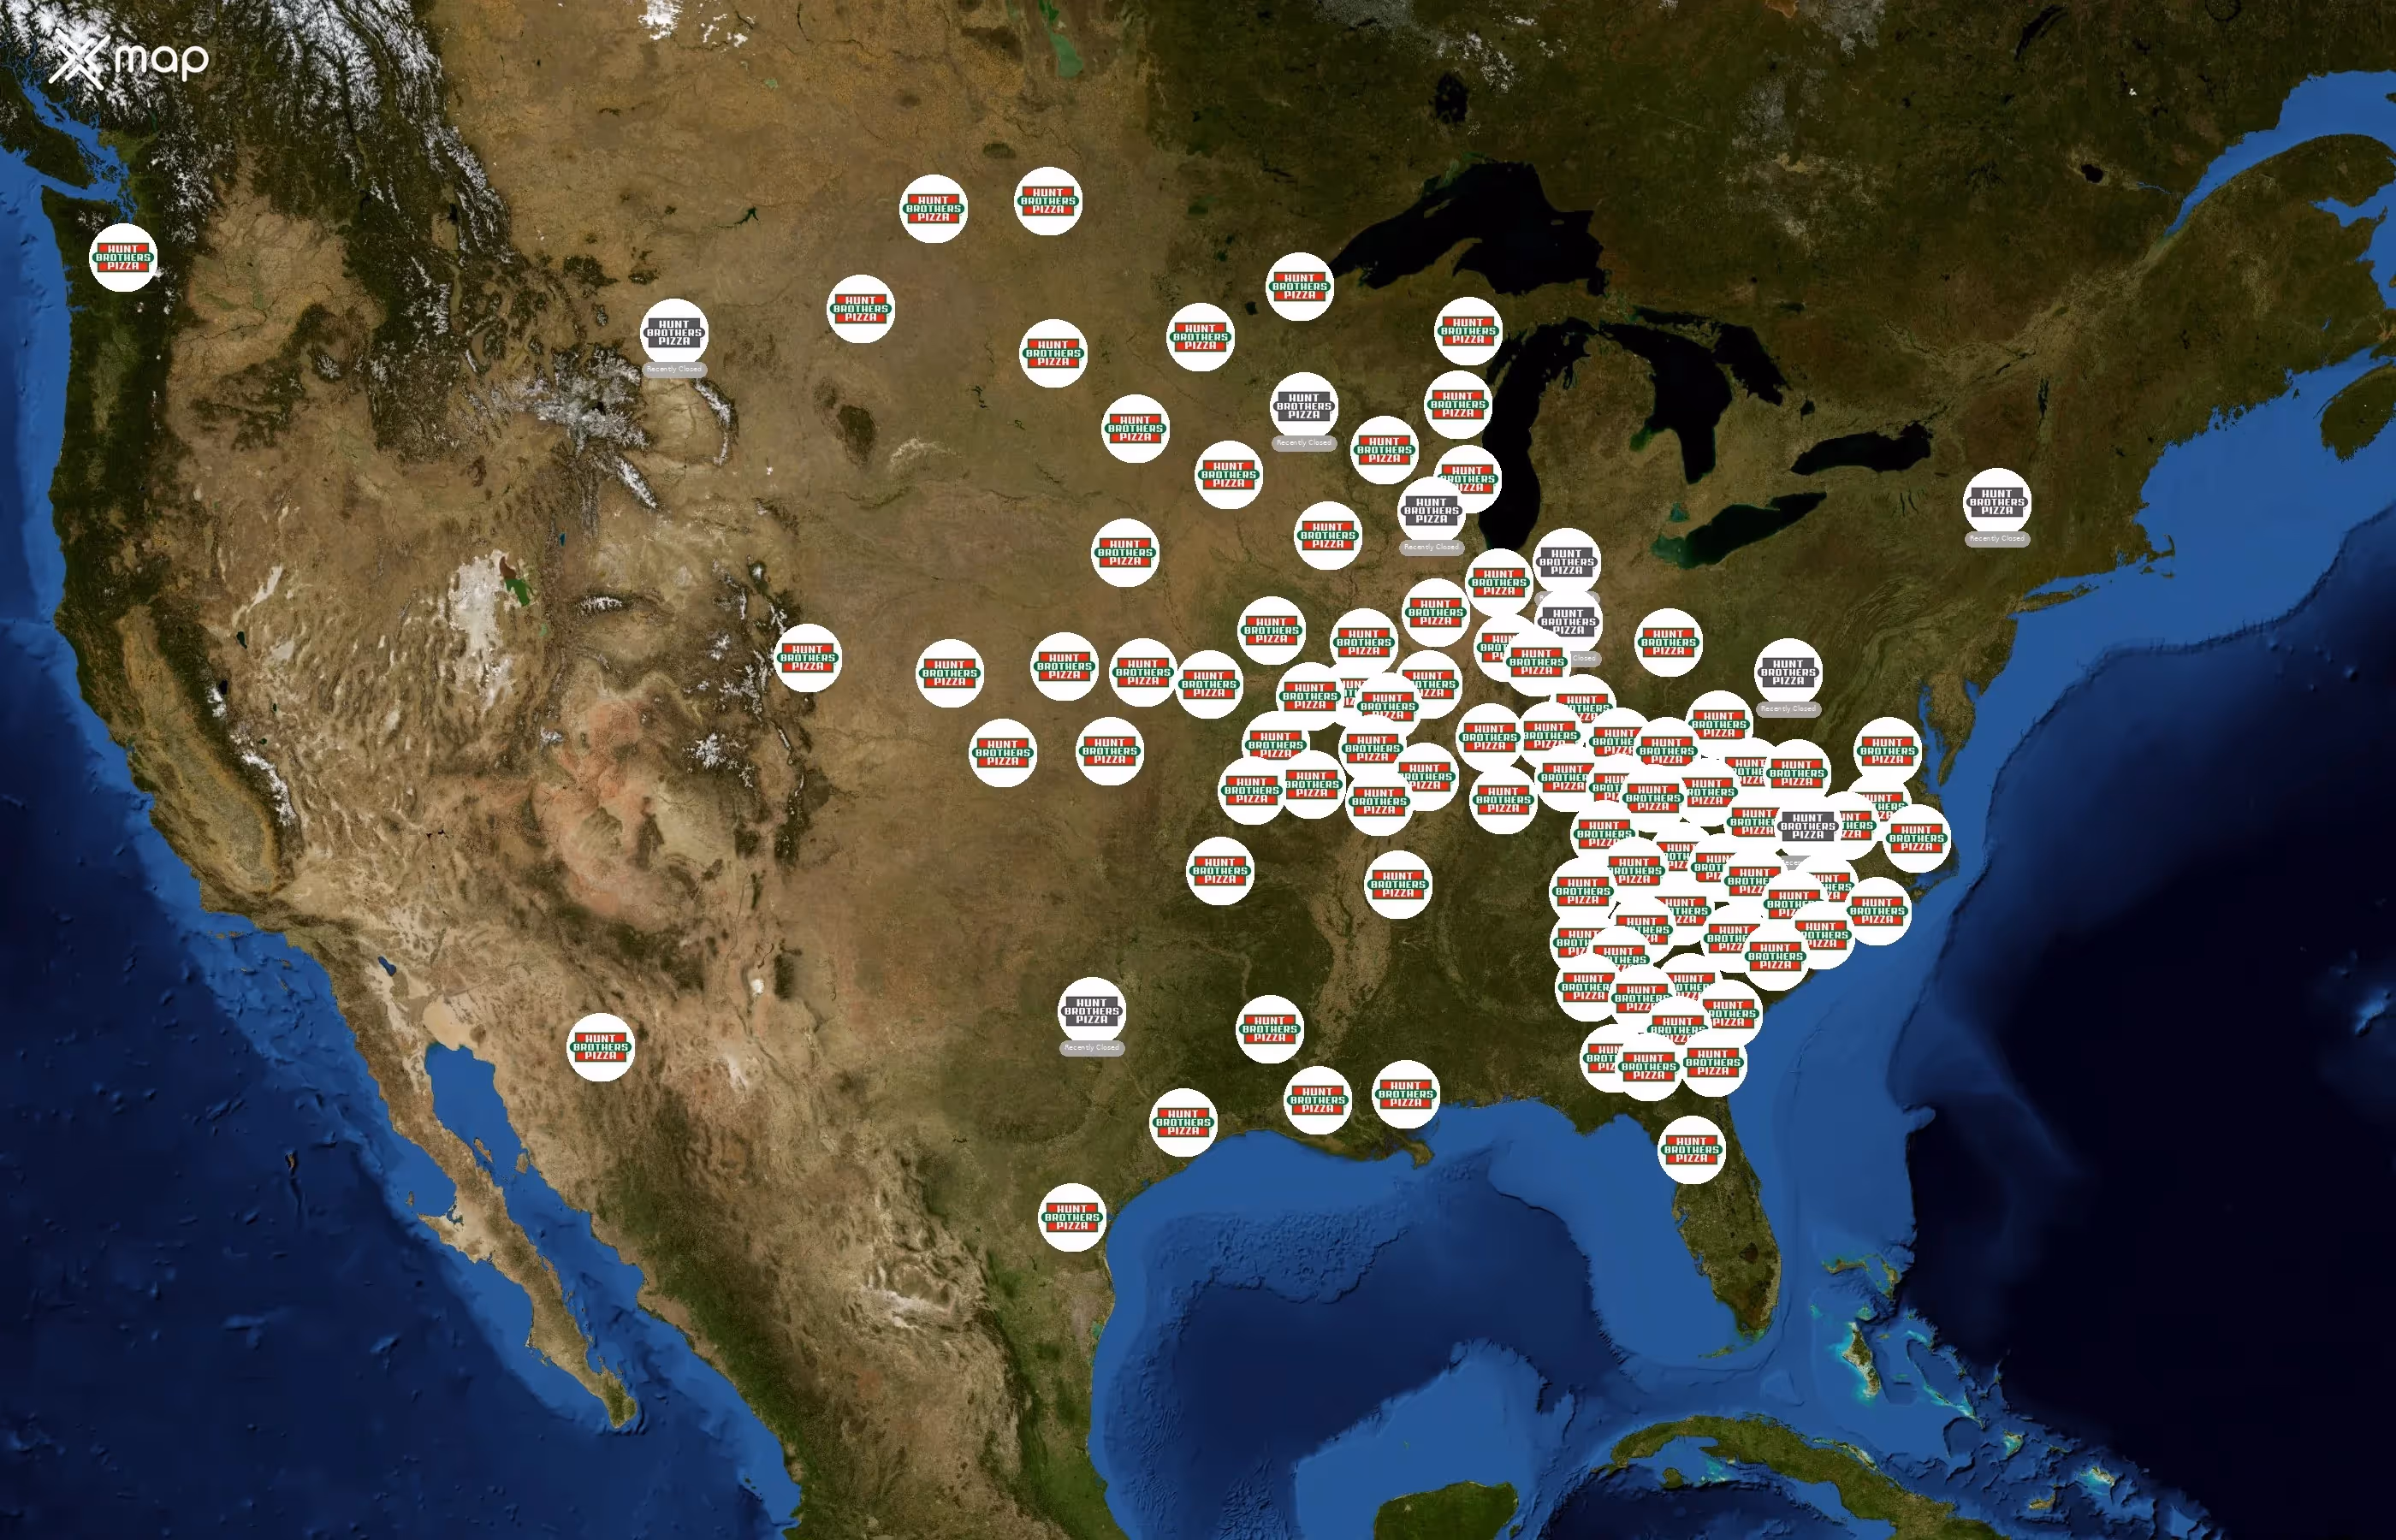
アメリカ合衆国全域の州別のハント・ブラザーズ・ピザ店の分布
ハント・ブラザーズ・ピザは、35の州で3,952の店舗を運営しています。最大のクラスターはジョージア州、ノースカロライナ州、ケンタッキー州で、上位10州には 86.2% のサイトが含まれています。対象地域はコロンビア特別区、ハワイ、ワシントン州ほど狭くなっています。
アメリカ合衆国でハント・ブラザーズ・ピザの店舗数が最も多い州トップ10
Hunt Brothers Pizzaは訪問者のエンゲージメントが強く、平均トラフィックスコア(平均:43.66)を上回る店舗が1,520か所、訪問者数が多いと評価されたのは517か所です。
ハント・ブラザーズ・ピザは全米に3,952店舗を展開しており、最も集中しているのはジョージア州で、全体の21.7%(857か所)を占めています。上位3州(ジョージア州、ノースカロライナ州、ケンタッキー州)を合わせると、全地域の 43.5% を占めています。ケンタッキー州、ジョージア州、ミズーリ州は、場所ごとの人口が最も少なく、アクセスが最も良好です。一方、ニューヨーク、ワシントン、アリゾナは最も人口が密集しており、それぞれの場所あたりの人口は 700 万人を超えています。上位10州は、同ブランドの全拠点の 86.2% を占めています。
ハント・ブラザーズ・ピザの一人当たりのインサイト
- ハント・ブラザーズ・ピザは、一人当たりのアクセスが最も良い州(ケンタッキー州、ジョージア州、ミズーリ州)です。
- ノースカロライナ州、インディアナ州、バージニア州、イリノイ州、テネシー州などの州は、多数の拠点があるにもかかわらず、1人あたりのサービスが行き届いておらず、郊外への拡張需要が見込まれています。
- いくつかの州では、人口増加とハント・ブラザーズ・ピザの密度のバランスを取っているため、競争が続くホットスポットとなっています。
アメリカ合衆国でハントブラザーズのピザ店が最も多い都市
場所は、ロブソン、アンダーソン、セジウィック、キャロル、ローレルなどの主要メトロに集中しています。上位 10 都市は米国のサイトの 5.1% を占めています。

ロケーション数でランク付けされた都市トップ10
ハント・ブラザーズ・ピザは、全米に合計3,952店舗を構えています。店舗数が最も多い都市はノースカロライナ州ロブソンで、28店舗あり、次いでサウスカロライナ州アンダーソンが27店舗あります。上位10都市を合わせると、全国のハント・ブラザーズ・ピザの全店舗の 5.1% を占めています。
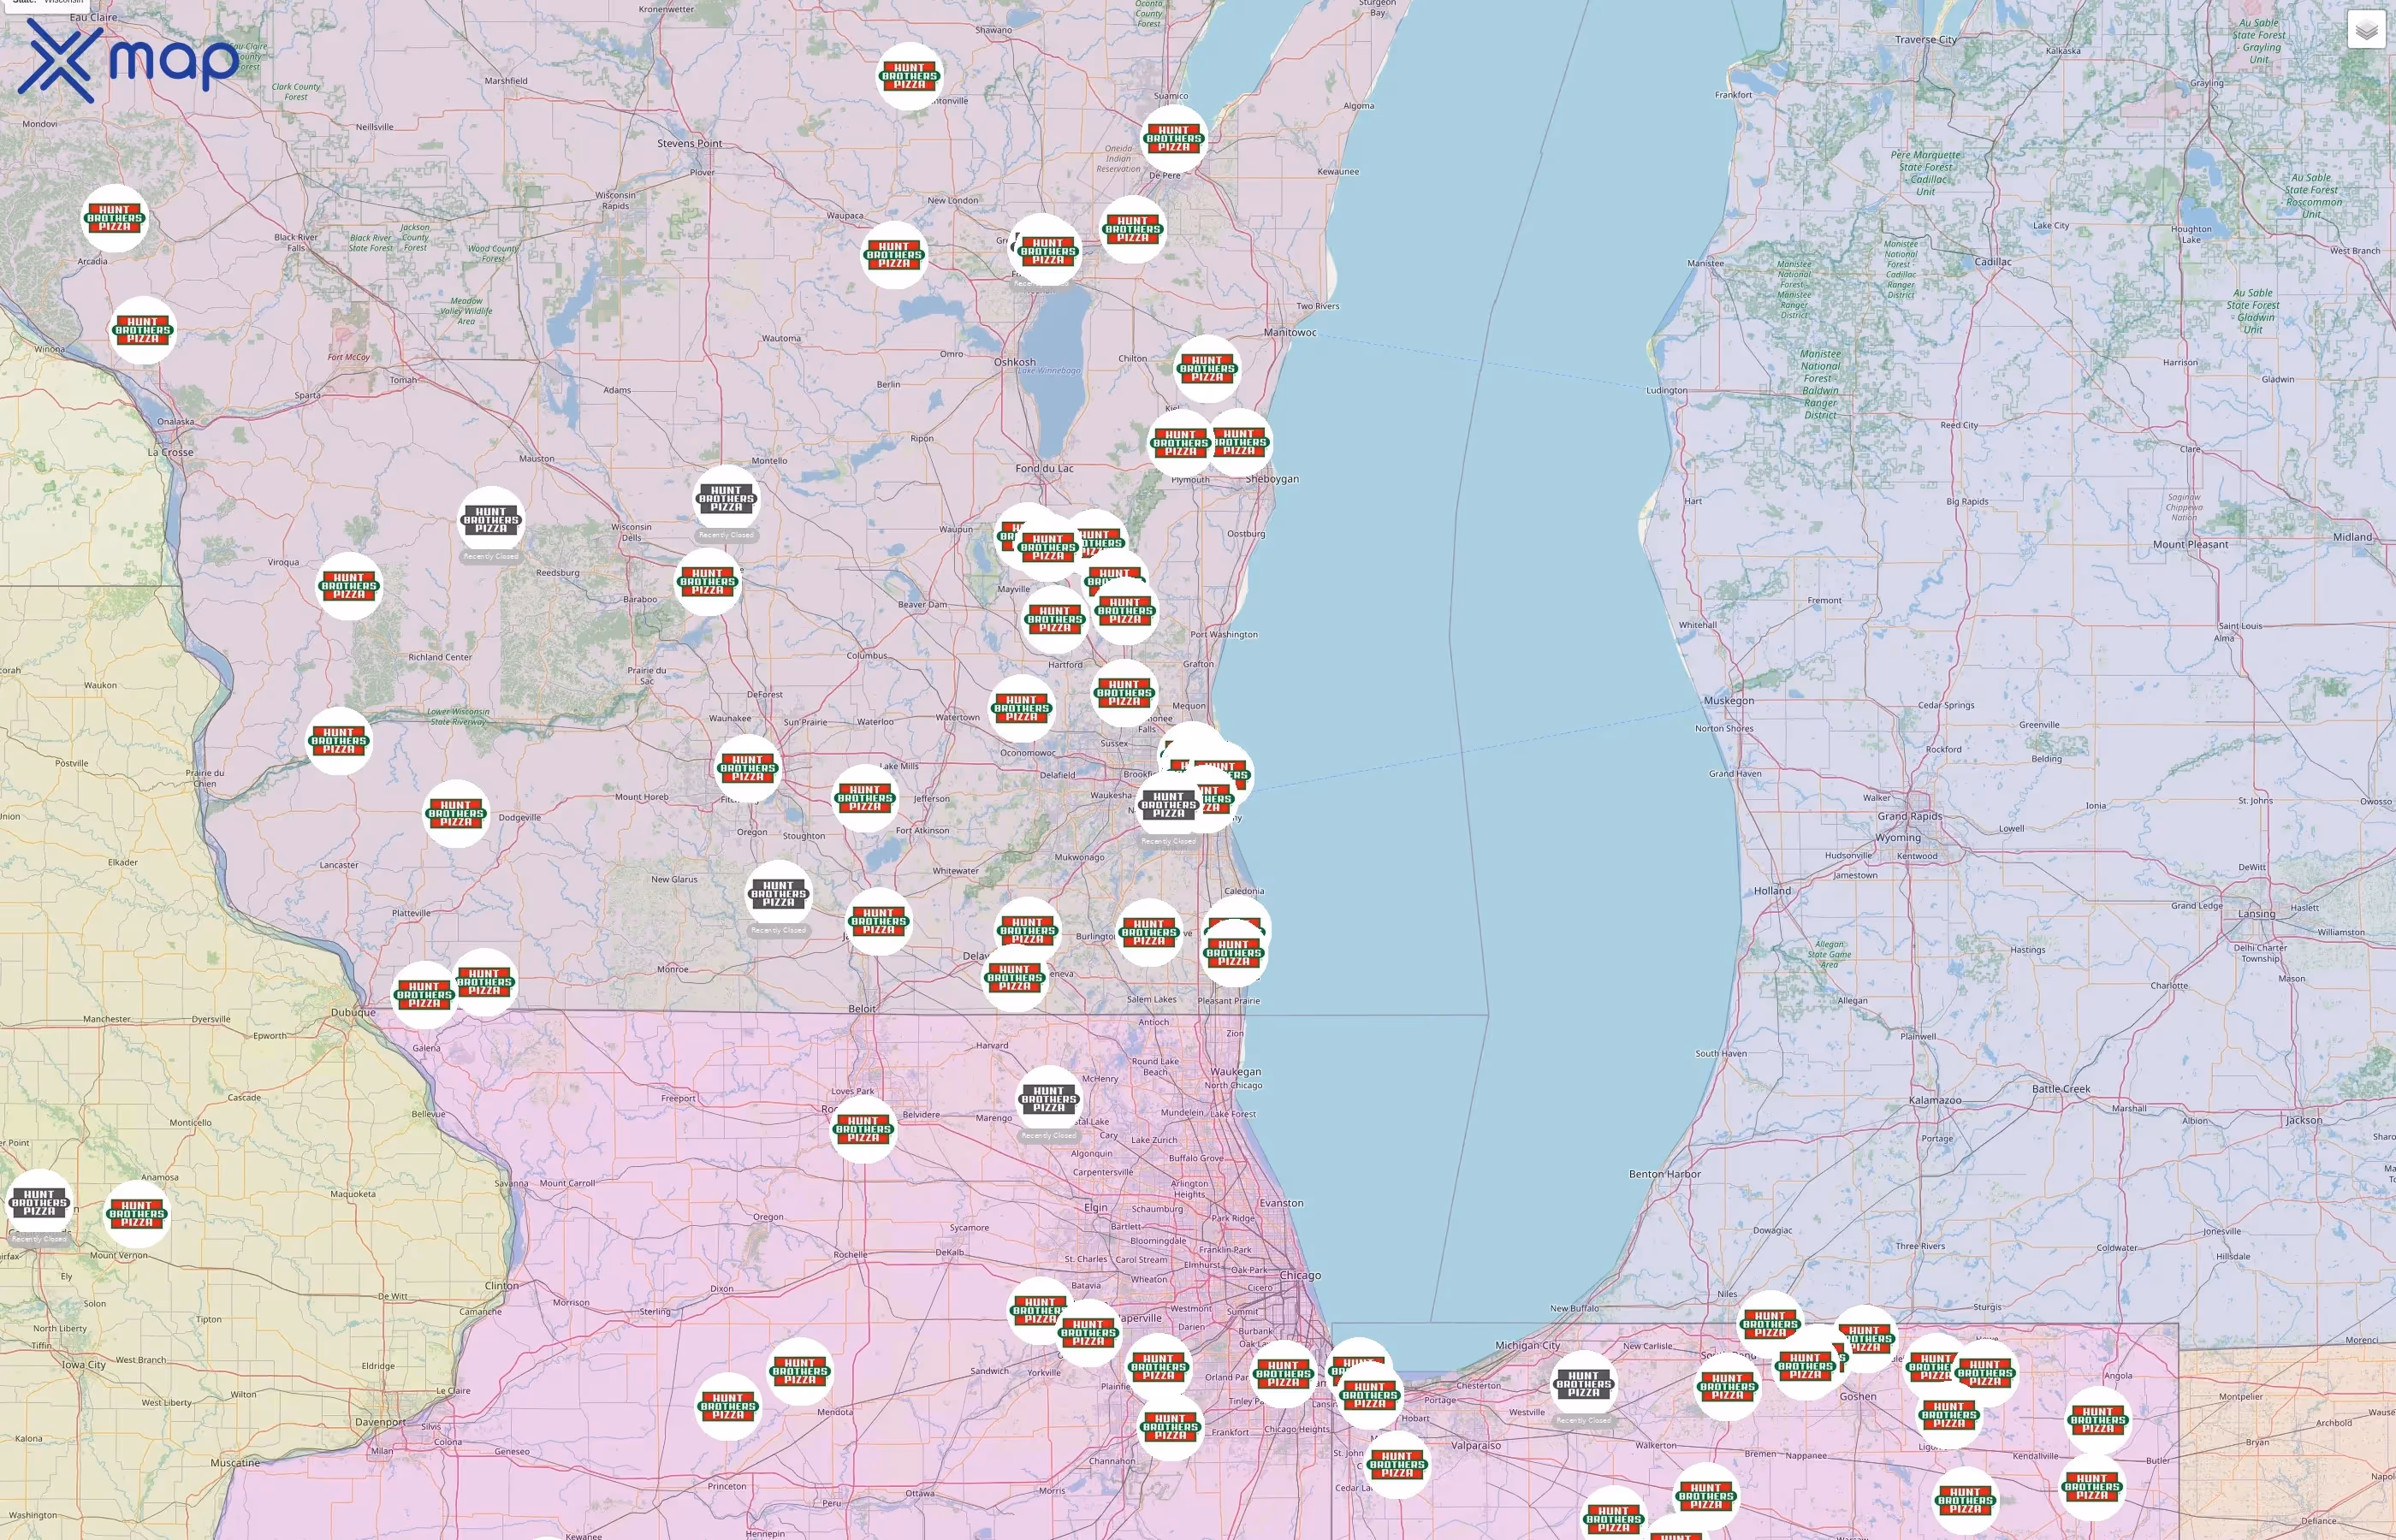
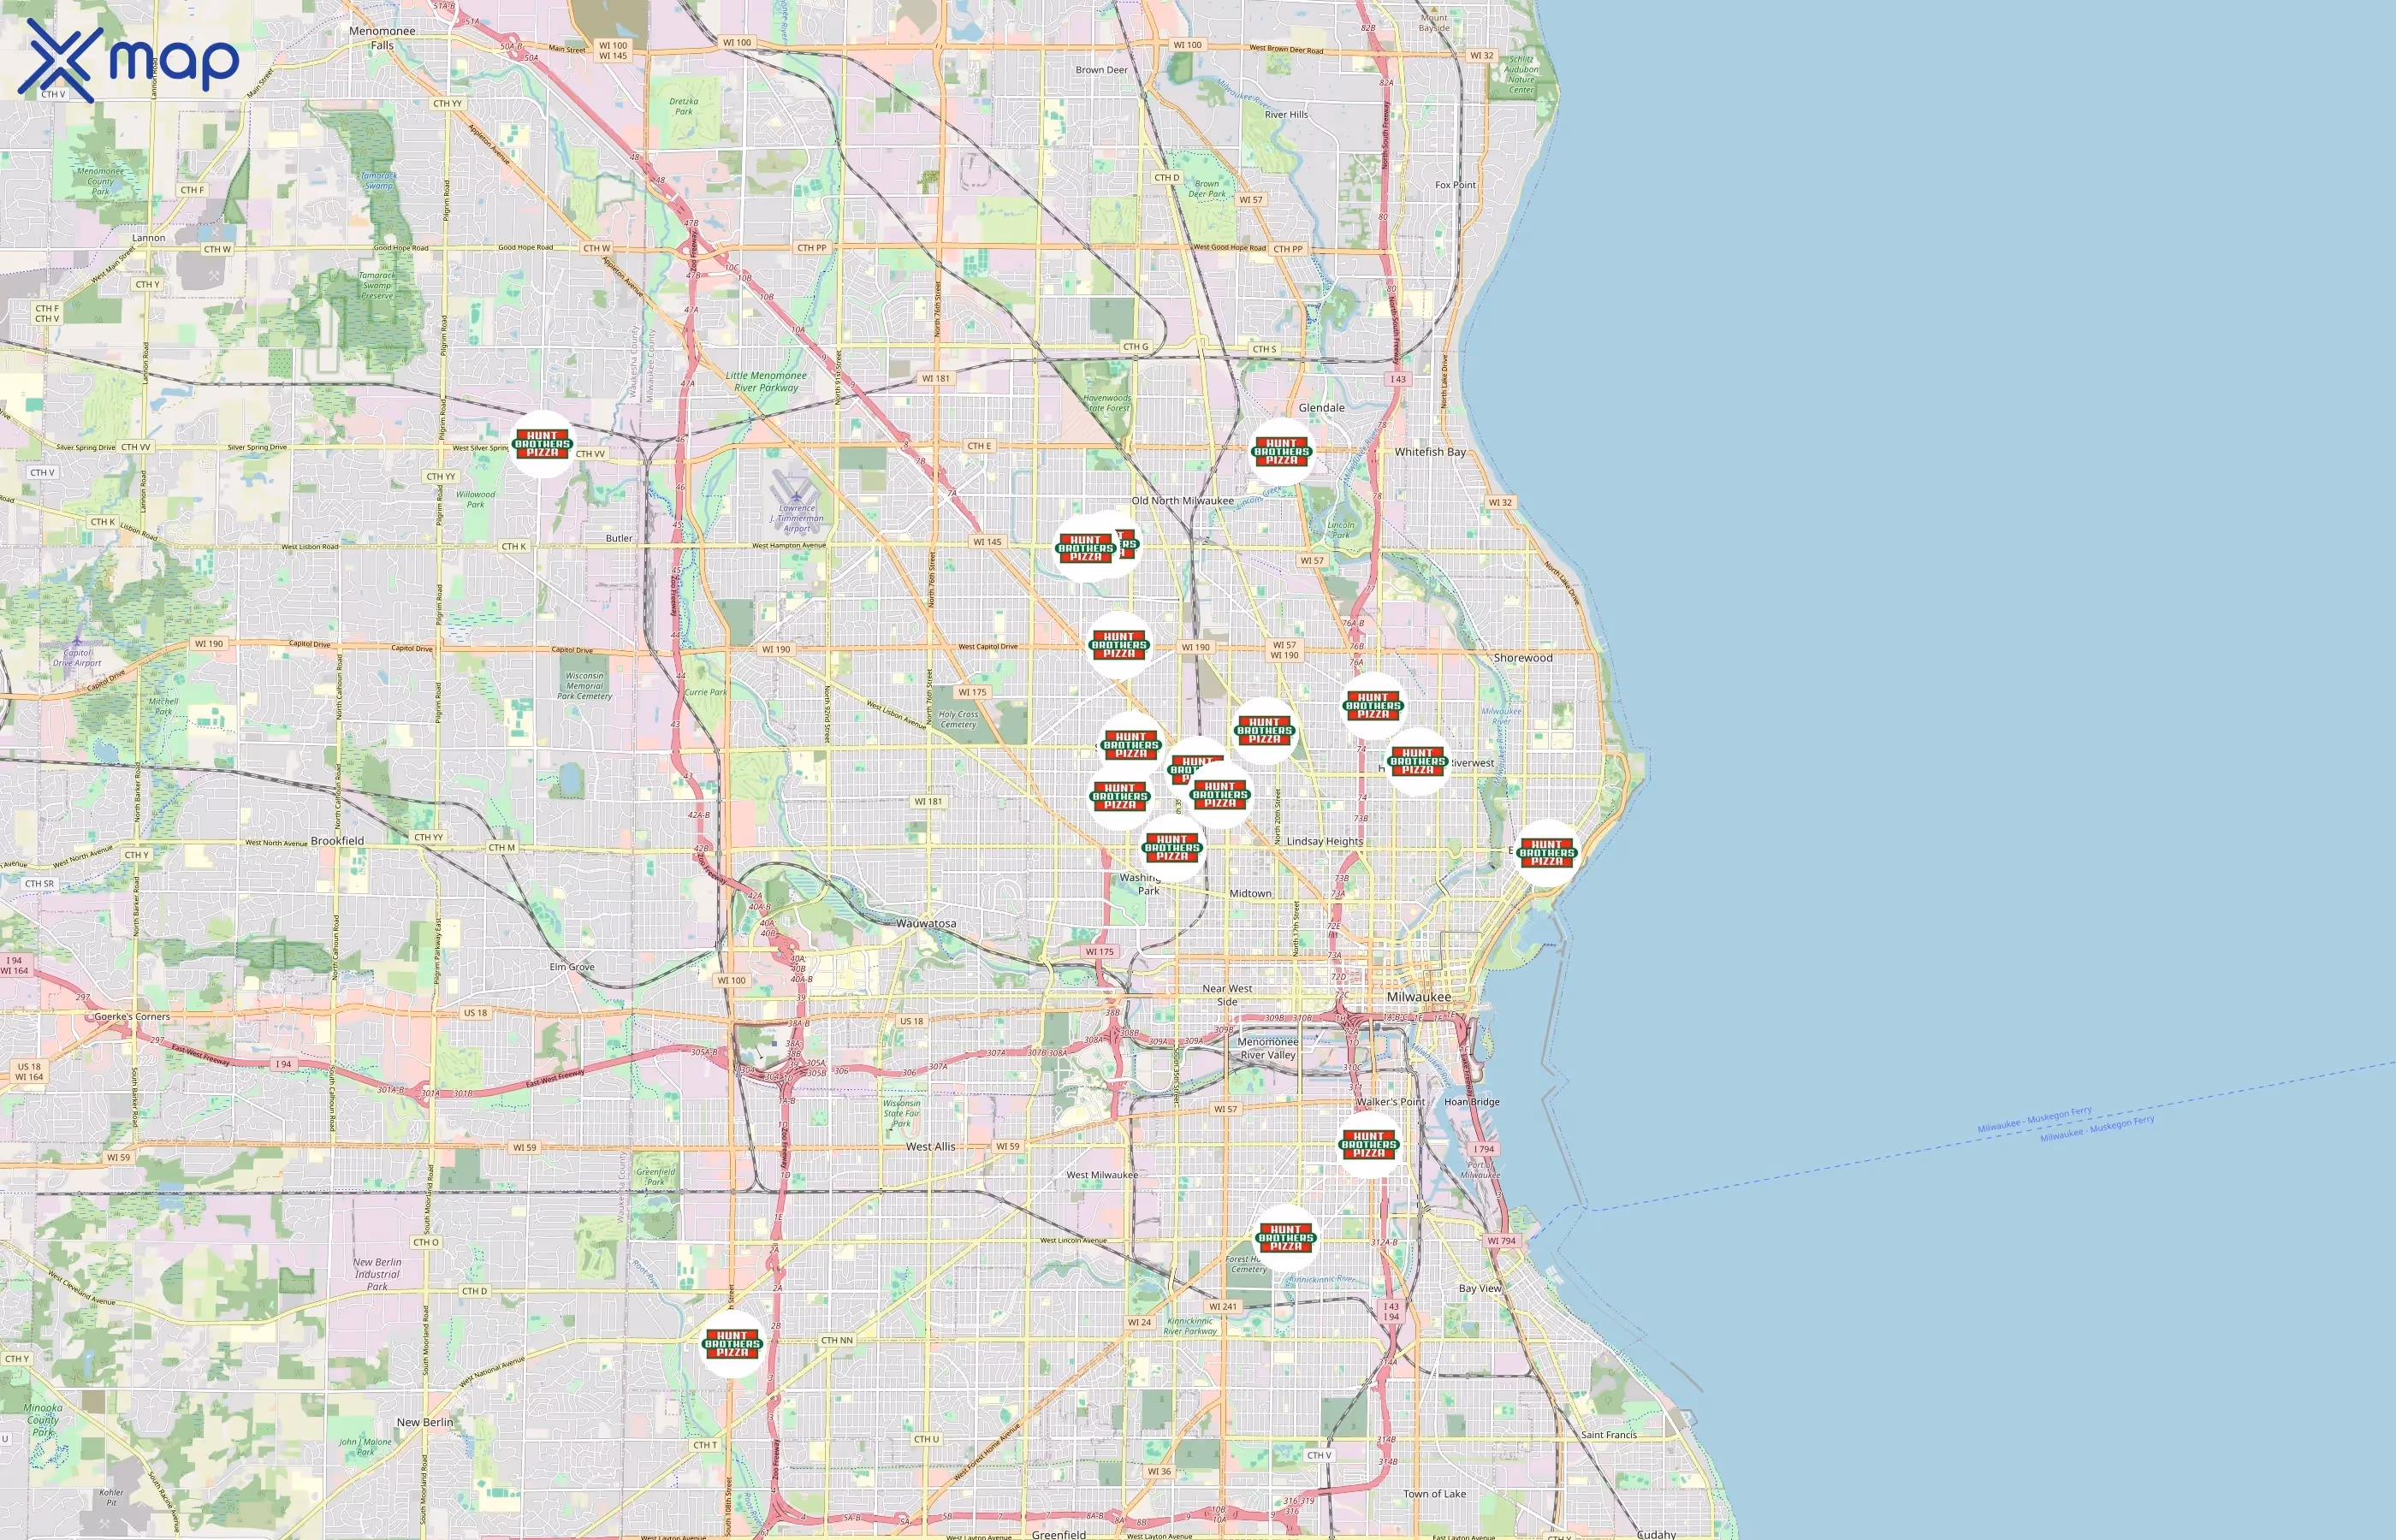
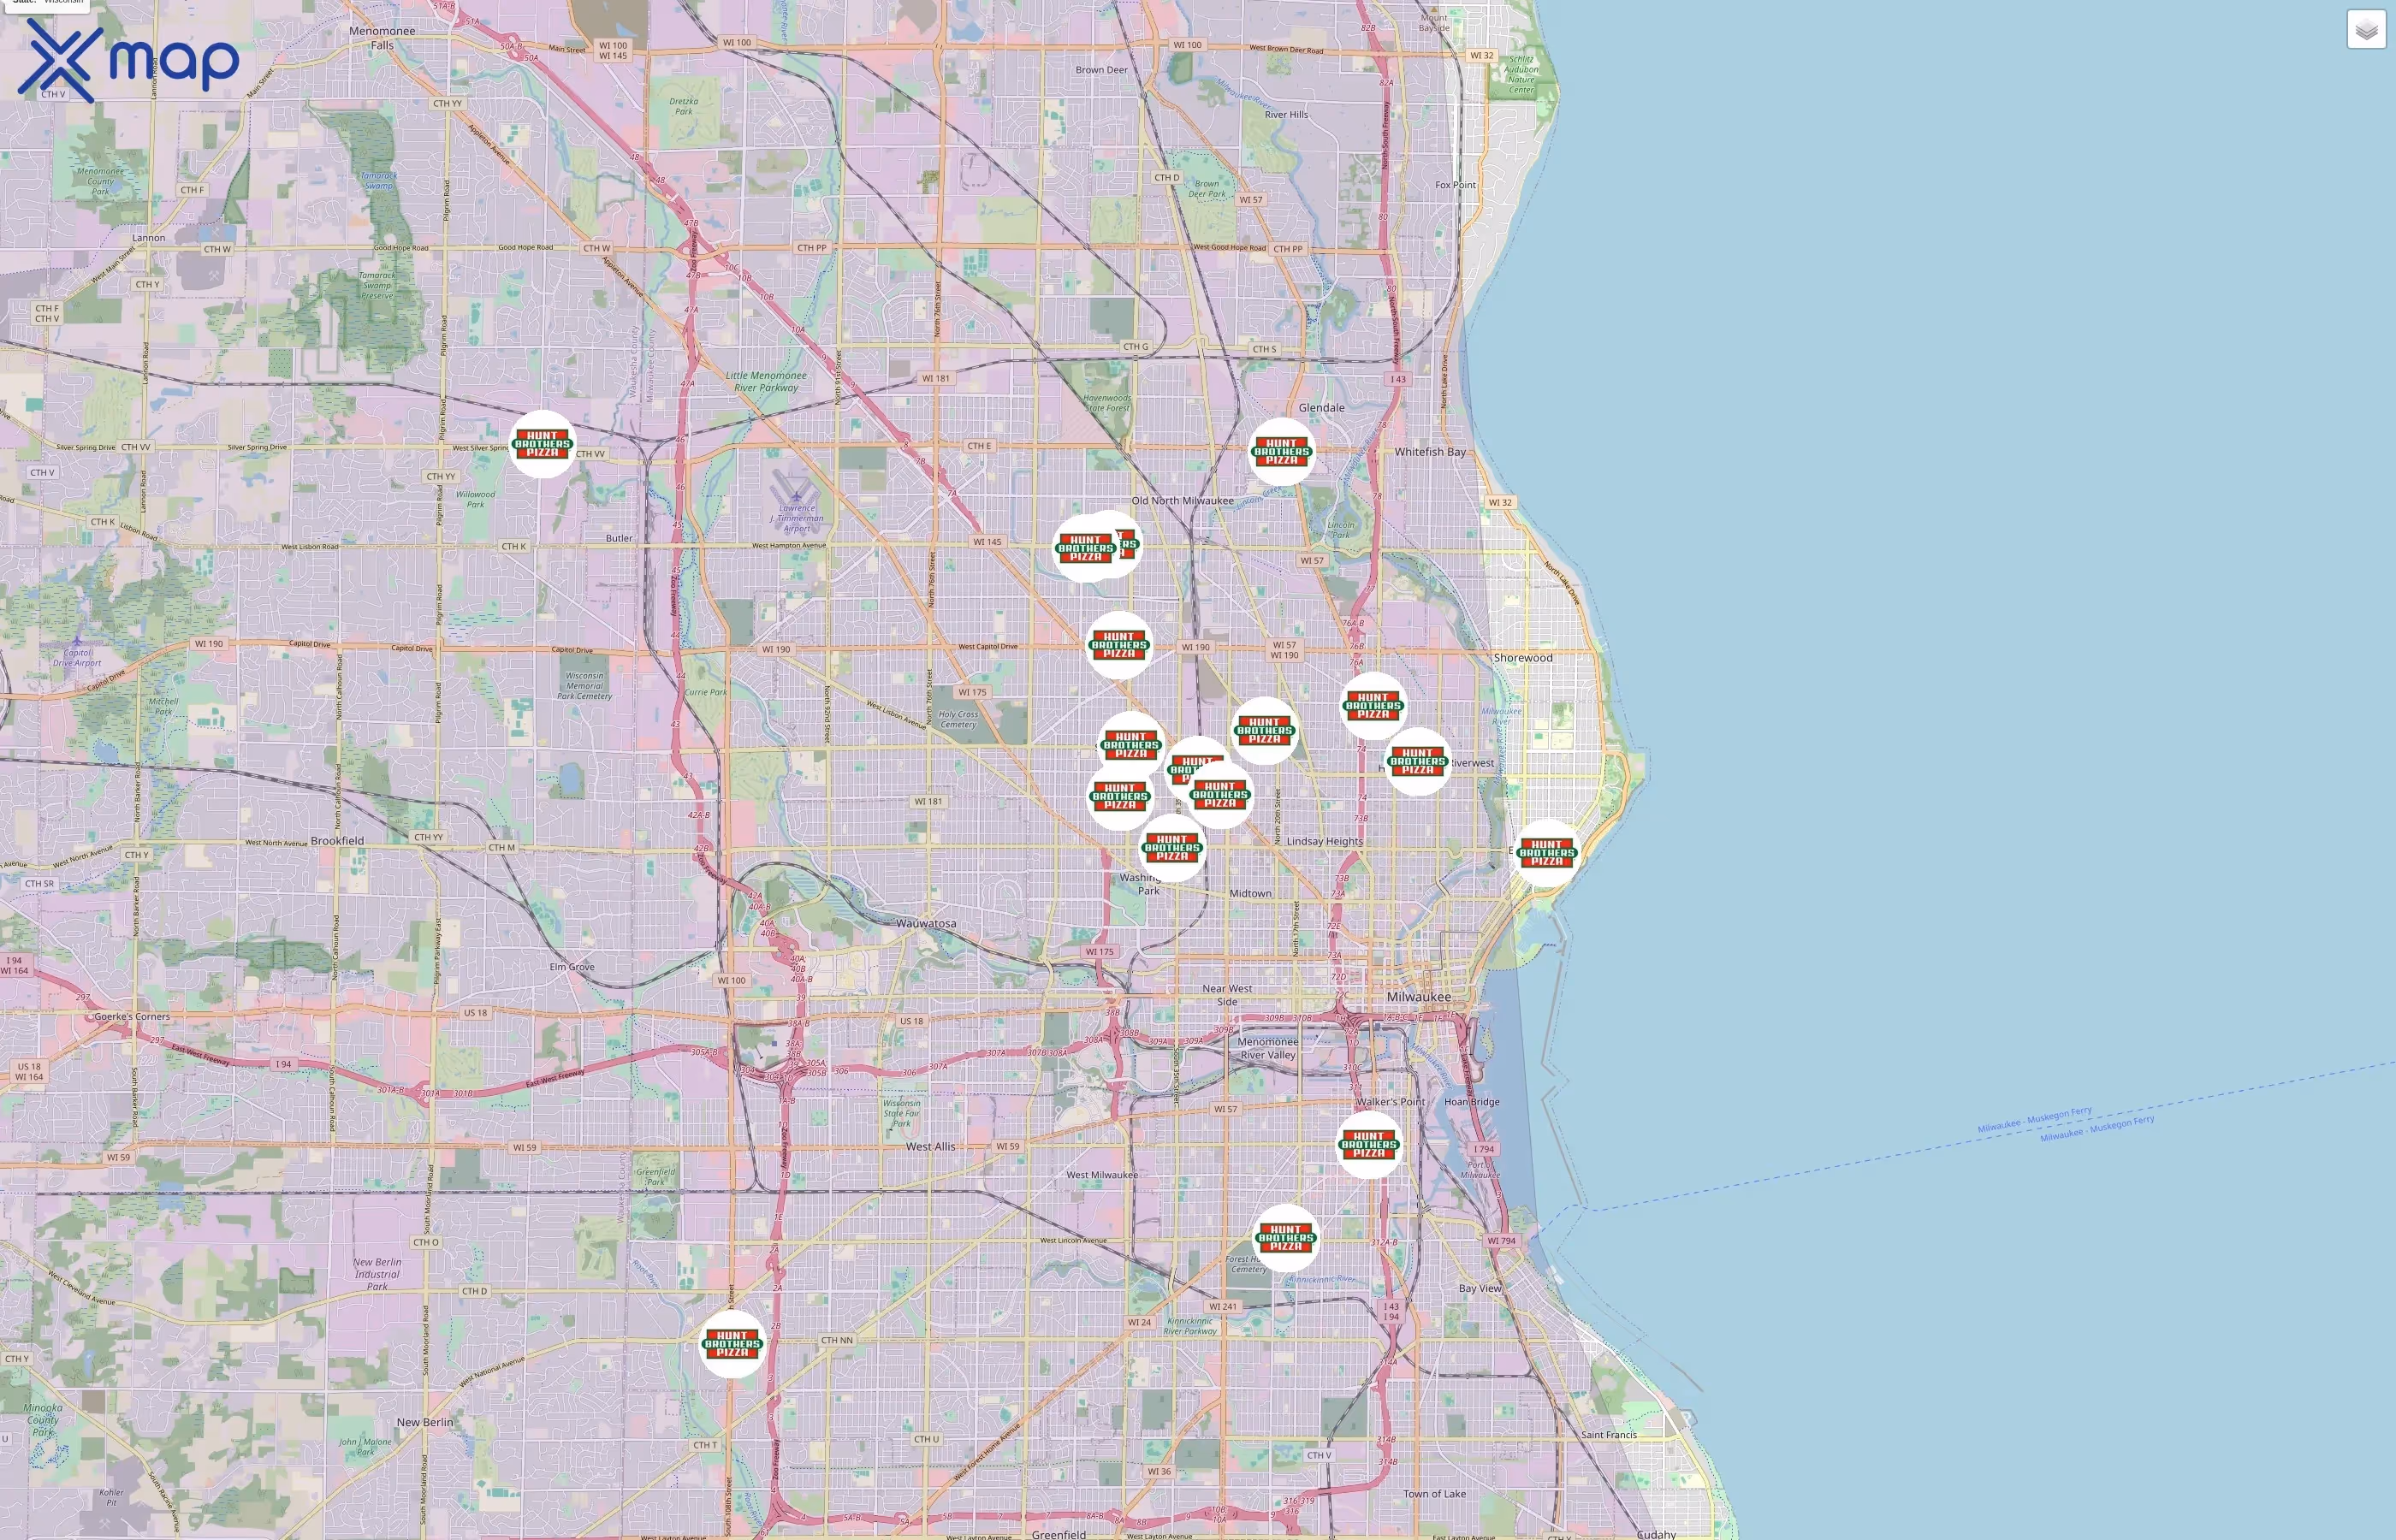
ストリートレベルのホットスポット(ハントブラザーズピザが複数ある最もにぎやかな通り)
ストリートレベルのクラスターを見ると、同じエリア内に複数のハント・ブラザーズ・ピザの店舗が並んでいる回廊が分かります。これは、地域的な存在感と一貫性が強いことを示しています。ハント・ブラザーズ・ピザは、全国で合計3952店舗を運営しています。
ハント・ブラザーズ・ピザ・アウトレットのポイント・オブ・インタレスト・データをダウンロード
座標、交通パターン、運行状況など、アメリカ合衆国全土のハント・ブラザーズ・ピザの店舗の完全なデータセットをダウンロードできます。
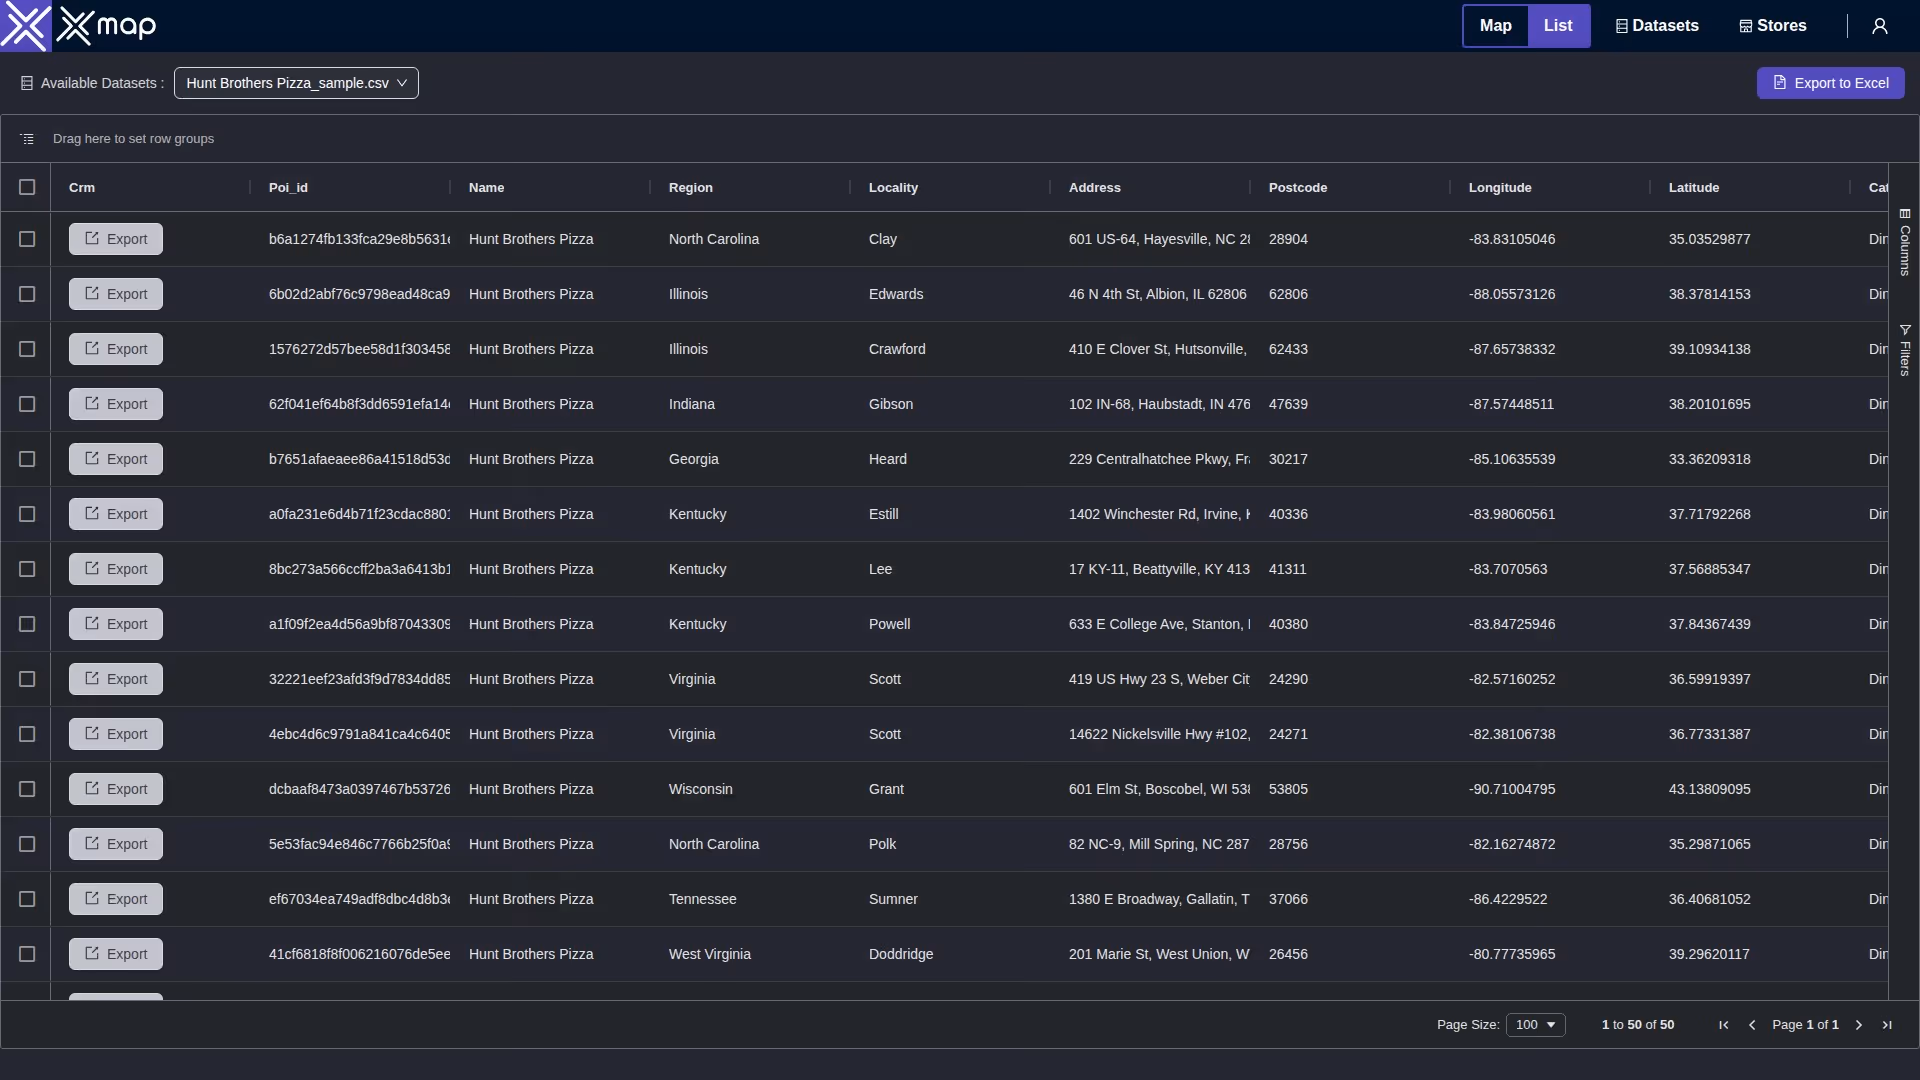
ハント・ブラザーズ・ピザの注目ポイントの主な変数
ハント・ブラザーズ・ピザは、アメリカ合衆国全土に3952店舗を構えています。主要な変数は、全国のハント・ブラザーズ・ピザの店舗で最も影響の大きい側面を示しています。これにより、ハント・ブラザーズ・ピザがどのように運営されているかをさまざまな観点から詳しく見ることができます。
ハントブラザーズのピザ店ごとの平均カバーエリア(州別)
米国のハント・ブラザーズ・ピザの店舗は、国土の異なる複数の州に分散しています。カンザス州は国内最大の州で、面積は213,099.5km²で、169の店舗があります。サウスカロライナ州は、土地面積が82,940.4km²と最も小さい州で、278の州があります。ジョージア州は、面積が 153,905.0 km² で 3 番目に大きい州であるにもかかわらず、ロケーション数は 857 か所とトップです。
ハントブラザーズピザ店の営業状況(オープンとクローズ)

Hunt Brothers Pizzaは、米国の主要州全体で営業している店舗の割合が高く、閉店は報告されていません。453 店舗のうち 94.7% が開店しているのはノースカロライナ州が首位で、次いでテネシー州が 93.5%、バージニアが 93.2% となっています。開設店舗数は 857 か所のうち 759 か所とジョージア州が最も多く、営業拠点は 88.6% を占めています。カンザス州は、上場州の中で 78.7% と最も低いオープン率を示しています。
ハント・ブラザーズ・ピザ店の交通データ (州別)
このビューでは、ハント・ブラザーズ・ピザ店周辺のアクティビティを州全体で比較しています。3,952 か所のサイト付近で観測されたトラフィックスコアを使用して、最も混雑する市場、平均以上のロケーションのシェアが高い州、およびアクティビティが比較的少ない地域が強調表示されます。パフォーマンスのベンチマーキング、現場業務の優先順位付け、事業拡大や最適化の機会の特定に活用してください。
上位10州のうち、ハント・ブラザーズ・ピザのどの店が賑わっていますか?
ハント・ブラザーズ・ピザの米国内で最も混雑している店舗は複数の州に分散しており、インディアナ州の混雑率が最も高いのは23.0%(全256店舗中59店舗)です。続いて 22.9% の混雑地域がケンタッキー州で、ジョージア州が193か所と最も多く、全857か所のうち 22.5% を占めるのはジョージア州です。ミズーリ州、サウスカロライナ州、カンザス州などの他の州でも、混雑率が 21% を超えていると報告されています。
ハントブラザーズピザ店のカスタマーレビューと評価
このセクションでは、ハント・ブラザーズ・ピザに対するお客様の感想をまとめています。3,952 か所の評価とレビューの合計を使用して、スコアが一貫して高く、フィードバックの量が最も多い場所に焦点を当てます。星による平均評価は質の高さを反映し、レビュー総数はネットワーク全体でのエンゲージメントとリーチを示します。
平均評価
ハント・ブラザーズ・ピザは、サウスカロライナ州とバージニア州で平均評価が4.5と最も高く、続いてジョージア州とノースカロライナ州が4.4点、イリノイ州が4.3点です。レビュー数はノースカロライナ州が1,066件でトップで、続いてジョージア州が1,056件で続いています。サウスカロライナ州、ケンタッキー州、テネシー州もレビュー数が多く、それぞれ 509 件、469 件、450 件となっています。
レビュー数
ハント・ブラザーズ・ピザは、サウスカロライナ州とバージニア州で平均評価が最も高く、どちらも4.5で、続いてジョージア州とノースカロライナ州が4.4点です。ノースカロライナ州がレビュー総数で1,066件で首位に立ち、続いてジョージア州が1,056件のレビューで続いています。サウスカロライナ州、ケンタッキー州、テネシー州も 450 件から 509 件とかなりの数のレビューが寄せられています。
確認済みの連絡先情報があるハントブラザーズのピザ店
連絡先情報
Hunt Brothers Pizzaは、米国内の全店舗で電話に対応しており、記載されている各州の店舗の100%が電話に対応しています。ジョージア州が857店舗で首位に立ち、続いてノースカロライナ州が453店舗、ケンタッキー州が411店舗となっています。表の 10 州すべてが、ハント・ブラザーズ・ピザの店舗の電話空き状況をすべて報告しています。
ハント・ブラザーズ・ピザ・ポイント・オブ・インタレスト・データのユースケース
市場分析
ハント・ブラザーズ・ピザのPOIデータにより、フットプリントと需要を明確に測定できます。アナリストは、州や都市を場所の数でランク付けし、対象地域を1人当たりの範囲で比較し、トラフィック・スコアとレビュー量を基に、パフォーマンスの高い市場やサービスの行き届いていない地域を特定できます。その結果、飽和状態、成長機会、業績外れ値を客観的に把握できます。
サイト選択
ネットワーク計画では、このデータは、立地密度、場所ごとの人口、および近隣の交通量を使用して候補商圏をスコアリングするのに役立ちます。チームは、店舗から最も近い距離から競合リスクを評価したり、主要な通路に沿って空白を浮き彫りにしたり、観察された活動が最も活発な小売店街、キャンパス、交通機関に近い場所に優先順位を付けたりできます。
都市計画
計画担当者は、クラスターとサービスギャップをマッピングして、近隣レベルでの商業アクセスを把握できます。一人当たりの調査ではアクセスが制限されているコミュニティが強調され、開館や閉鎖の変化は活動の変化を示唆しています。これらの洞察は、回廊の活性化、街並みと交通計画、データ主導のゾーニングの決定に役立ちます。
このxMapのPOIデータは企業にどのように役立ちますか?
- 精度と精度: xMap データは精度の高いデータを提供するため、欠陥のある情報に基づいて誤った判断を下す可能性が最小限に抑えられます。
- 完全なデータ: xMapを使用すると、企業は包括的で完全なデータにアクセスできるため、知識のギャップを効果的に埋め、意思決定のための包括的なビューを提供できます。
- 最新情報: xMapは、提供されたデータが定期的に更新されることを保証します。これにより、企業は現在の傾向や状況に合わせて、動的でタイムリーな意思決定を行うことができます。
- スケーラビリティ: xMap データは、さまざまな事業規模や要件に対応するインサイトを提供することで、事業を効率的に拡大することができます。
- 分析力: xMapデータの分析を活用することで、パターンや傾向を特定できるため、企業の戦略的計画と予測が強化されます。
ハント・ブラザーズ・ピザ・ポイント・オブ・インタレスト・データをダウンロード

アメリカ合衆国のハント・ブラザーズ・ピザ店の数
