Sydney Footfall Data | Two Working Days, 17 Percent Apart: A Week of Sydney Footfall
- Remove the current class from the content27_link item as Webflows native current state will automatically be applied.
- To add interactions which automatically expand and collapse sections in the table of contents, select the content27_h-trigger element, add an element trigger, and select Mouse click (tap).
- For the 1st click, select the custom animation Content 27 table of contents [Expand], and for the 2nd click, select the custom animation Content 27 table of contents [Collapse].
- In the Trigger Settings, deselect all checkboxes other than Desktop and above. This disables the interaction on tablet and below to prevent bugs when scrolling.
Sydney's footfall data covers a full week, not a single day. That changes what you can see, and the most interesting thing in it is not a place. It is a day.
Our first two footfall analyses each covered a single Tuesday. São Paulo held a flat 11 million people around the clock and rearranged them. New York added roughly 700,000 by mid-afternoon, imported from beyond its own boundary.
Sydney gave us something neither of those could: seven consecutive days, Monday 3 to Sunday 9 August 2026, at hourly resolution across roughly 7,300 hexagons.
With a week of data, the question stops being "where are people at 1pm" and becomes "which day are you asking about". For a lot of commercial decisions, that turns out to be the more important question.
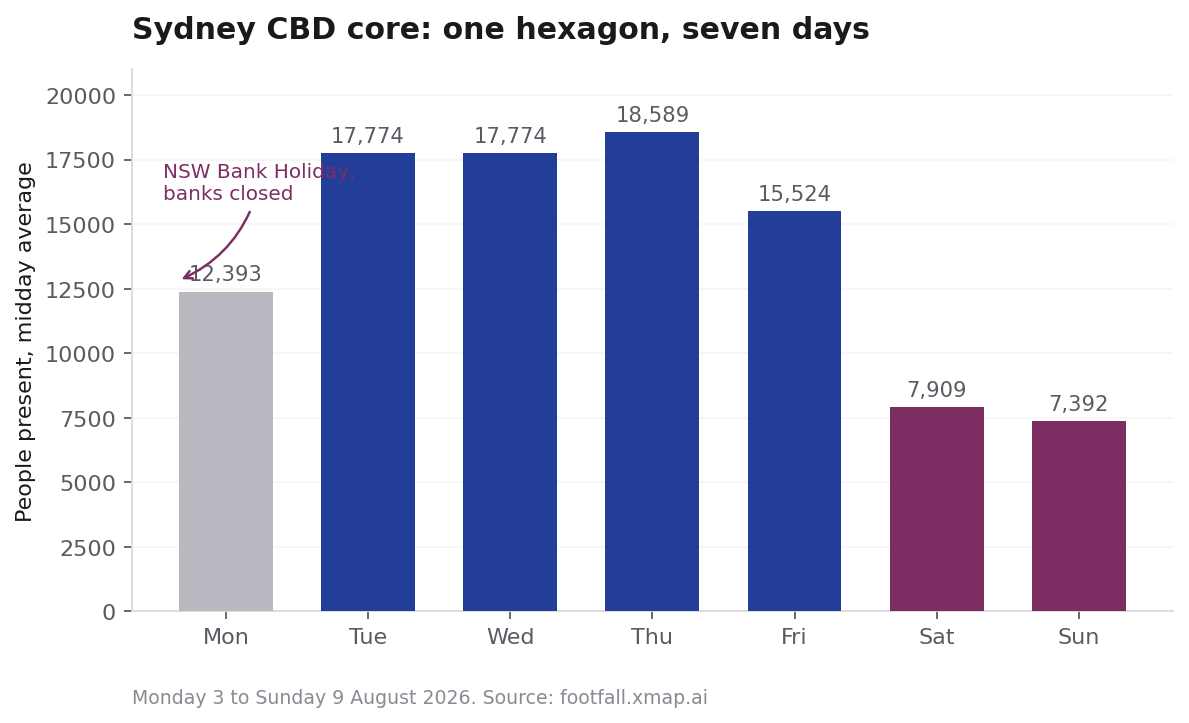
Here is the headline. In the core Sydney CBD hexagon, midday population runs at roughly 18,600 on a Thursday and 15,500 on a Friday. That is a 17 percent gap between two consecutive working days, in the same 0.9 km², one day apart.
Any plan built on a single weekday sample is, depending on which day it landed, potentially wrong by a quarter.
1. The working week has a shape, and Friday is not part of it
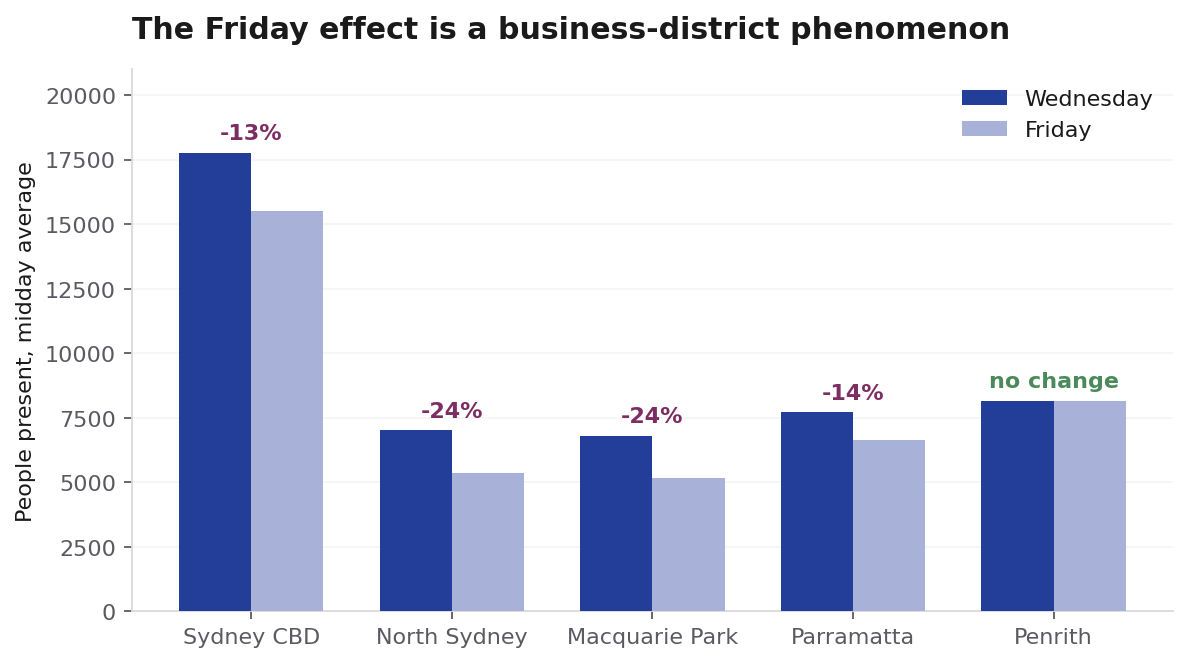
Across the 275 most office-dense hexagons in Greater Sydney, midday population indexed to each cell's own overnight baseline:
- Monday: 1.23x
- Tuesday: 1.34x
- Wednesday: 1.37x
- Thursday: 1.36x
- Friday: 1.33x
- Saturday: 1.20x
- Sunday: 1.18x
Two things stand out.
The midweek peak is Wednesday, not Monday. The office week is a hump, not a plateau, and it is centred on Wednesday and Thursday.
The weekend floor is higher than you would expect. Saturday sits at 1.20x, meaning office-dense areas still pull 20 percent above their overnight baseline on a Saturday. These are mixed-use districts, not deserted towers.
A caveat on Monday, and it matters. Monday 3 August 2026 was the NSW Bank Holiday. That is not a general public holiday, but it does close retail bank branches and certain financial institutions. Sydney's CBD is finance-heavy, so the Monday figure is depressed by an amount we cannot separate from the underlying hybrid-work pattern. We have excluded Monday from every comparison in this article and read Tuesday to Friday as the clean window.
2. The Friday effect is a business-district phenomenon, not a city-wide one
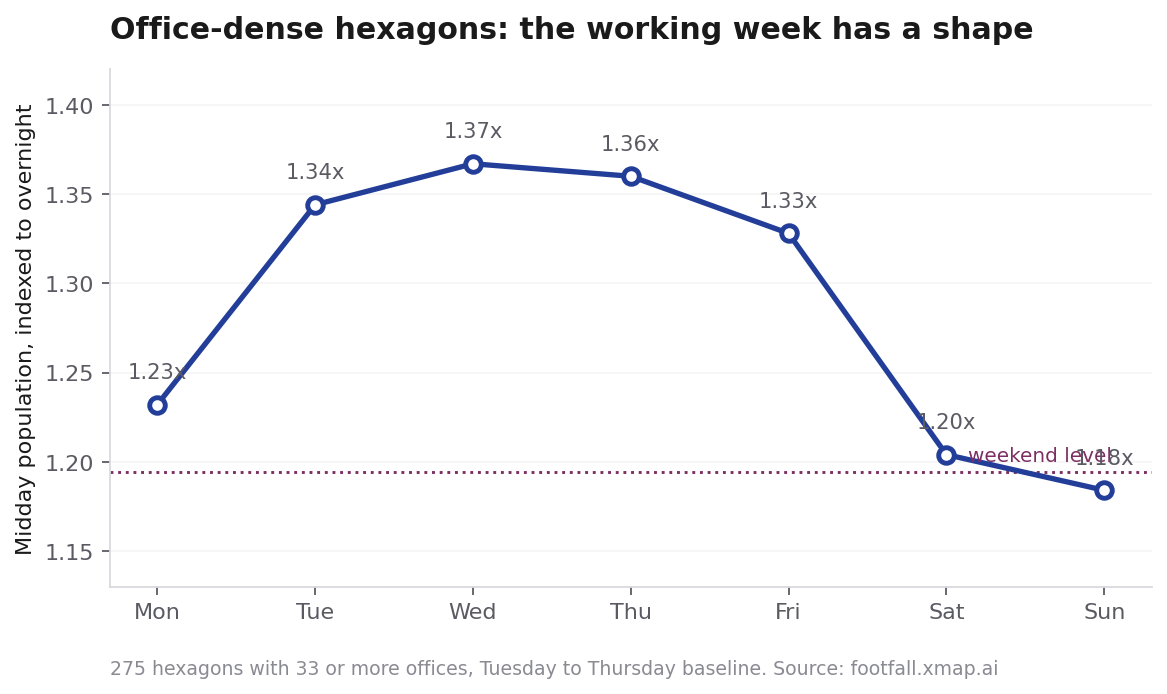
Comparing Wednesday to Friday midday population in five commercial centres:
- North Sydney: 24 percent lower on Friday (7,012 to 5,348)
- Macquarie Park: 24 percent lower (6,794 to 5,177)
- Parramatta: 14 percent lower (7,708 to 6,623)
- Sydney CBD: 13 percent lower (17,774 to 15,524)
- Penrith: no change at all (8,153 to 8,153)
Penrith is the finding here.
North Sydney and Macquarie Park, which are close to pure office and business-park environments, lose a quarter of their weekday crowd on Fridays. Parramatta and the CBD, which are more mixed, lose about half as much, because retail, hospitality and residential activity partly fills the gap.
Penrith, a regional centre anchored by retail rather than offices, does not move at all. Its Friday is identical to its Wednesday, and its Saturday sits only 15 percent below.
The practical read: if you are underwriting a retail or hospitality site, "office district" and "regional centre" are not two flavours of the same thing. One has a four-day revenue week. The other has a seven-day one. Rent per square metre will not tell you which you are buying.
3. Only one place in our sample is a genuine weekend destination
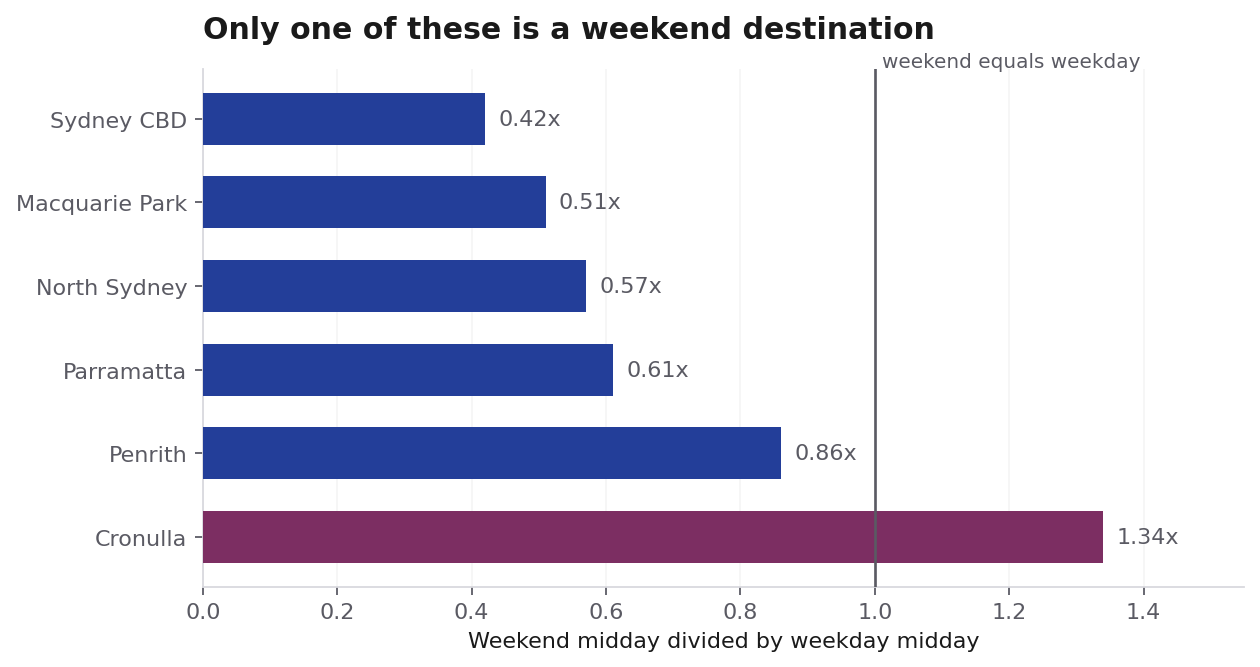
Dividing average weekend midday population by average weekday midday population:
- Sydney CBD: 0.42x
- Macquarie Park: 0.51x
- North Sydney: 0.57x
- Parramatta: 0.61x
- Penrith: 0.86x
- Cronulla: 1.34x
Cronulla is the only one of these busier on a weekend than a weekday, and it is not close. Its Sunday midday population runs about 37 percent above its Wednesday.
When we ranked every hexagon in Greater Sydney by weekend-to-weekday ratio, the top of the list was mostly not destinations at all. It was low-density outer suburbs where the ratio is high because residents simply stay home rather than commute out. Cronulla, a beach suburb with genuine visitor pull, was the clearest real destination in the set.
That is worth sitting with. In a city of five million, at hexagon resolution, genuine weekend magnets are rare. Most of what looks like weekend activity in aggregated data is just the absence of a commute.
4. The map cannot show you any of this
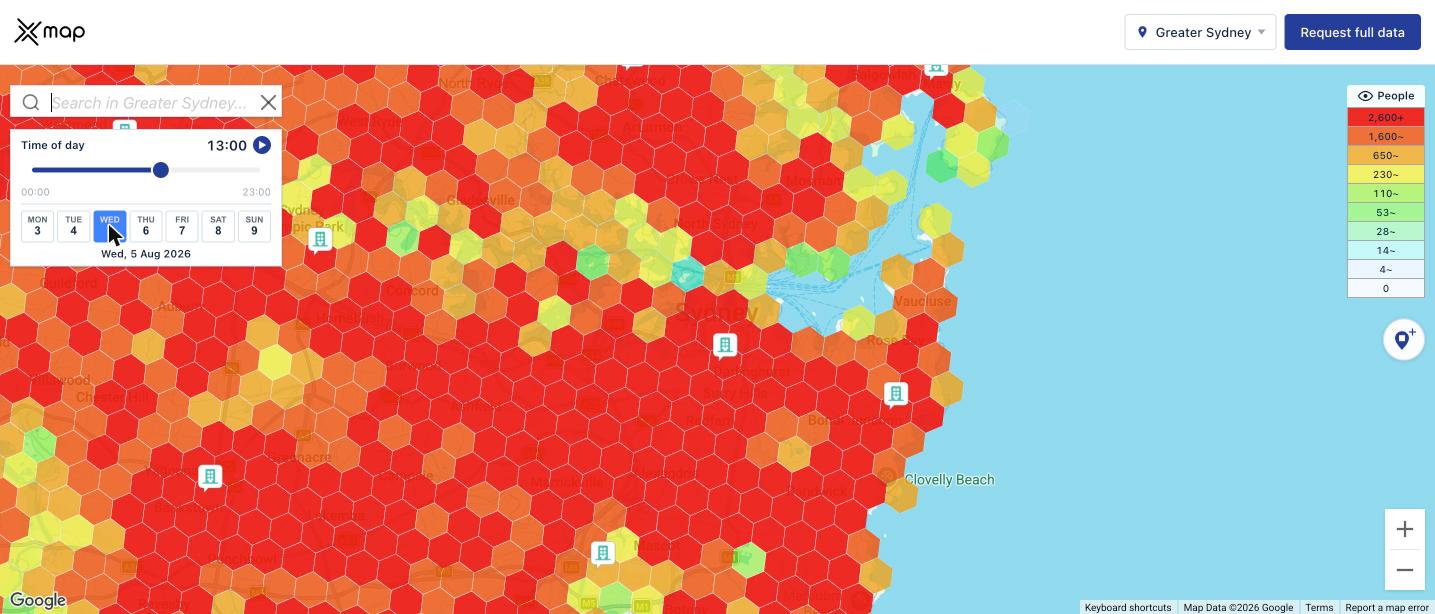
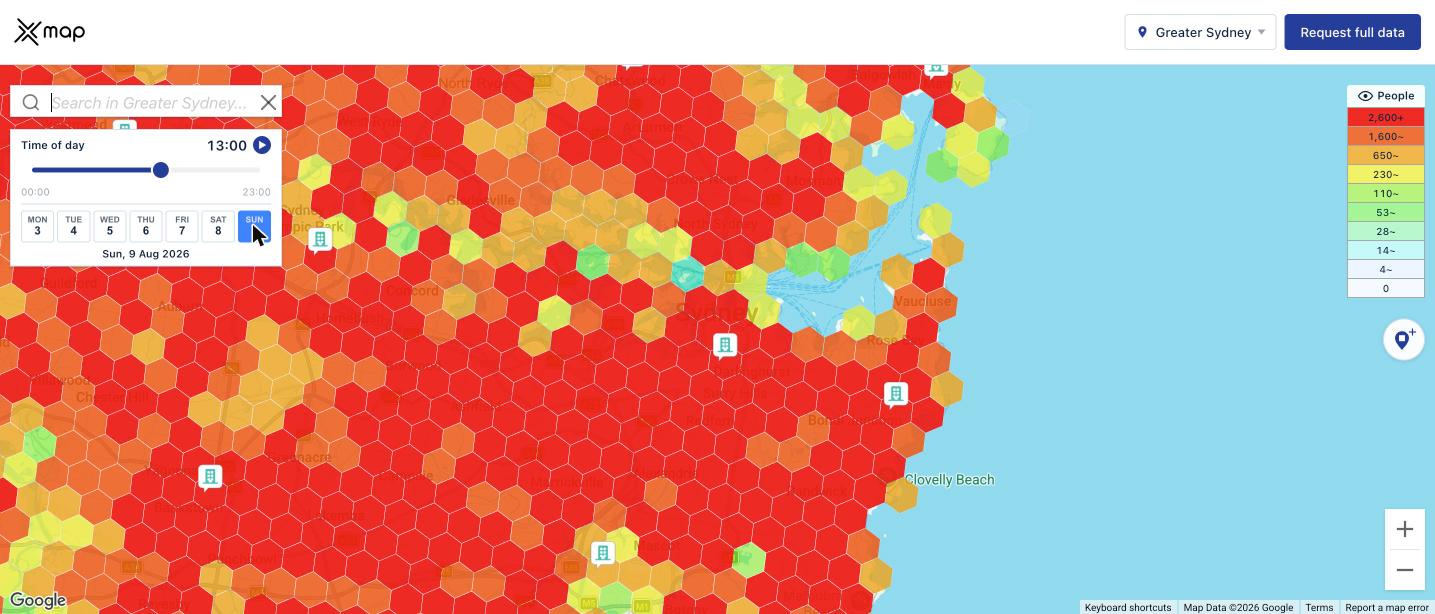
Those two frames are a full working week apart in behaviour and roughly 10,000 people apart in the CBD core. They are also, to the eye, identical.
This is not a flaw in the map. It is a property of how choropleth maps work. Both Wednesday and Sunday put the CBD hexagons in the top colour band, so the visual encoding saturates and the difference disappears. The map is doing its job, which is showing you where density is. It is structurally incapable of showing you when.
We are including these two frames deliberately, because the gap between what the map shows and what the data contains is the entire argument for working with the underlying numbers rather than the picture.
If your current location workflow ends at looking at a heatmap, this is what it is hiding from you.
5. One hexagon, close up
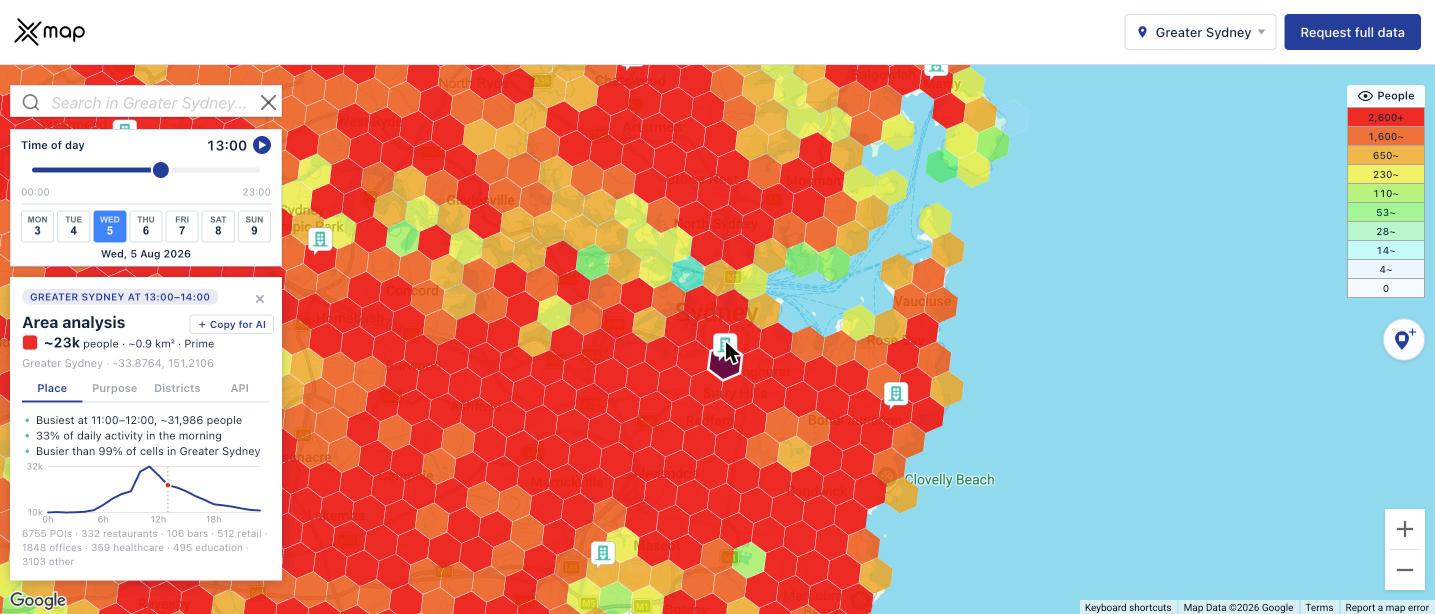
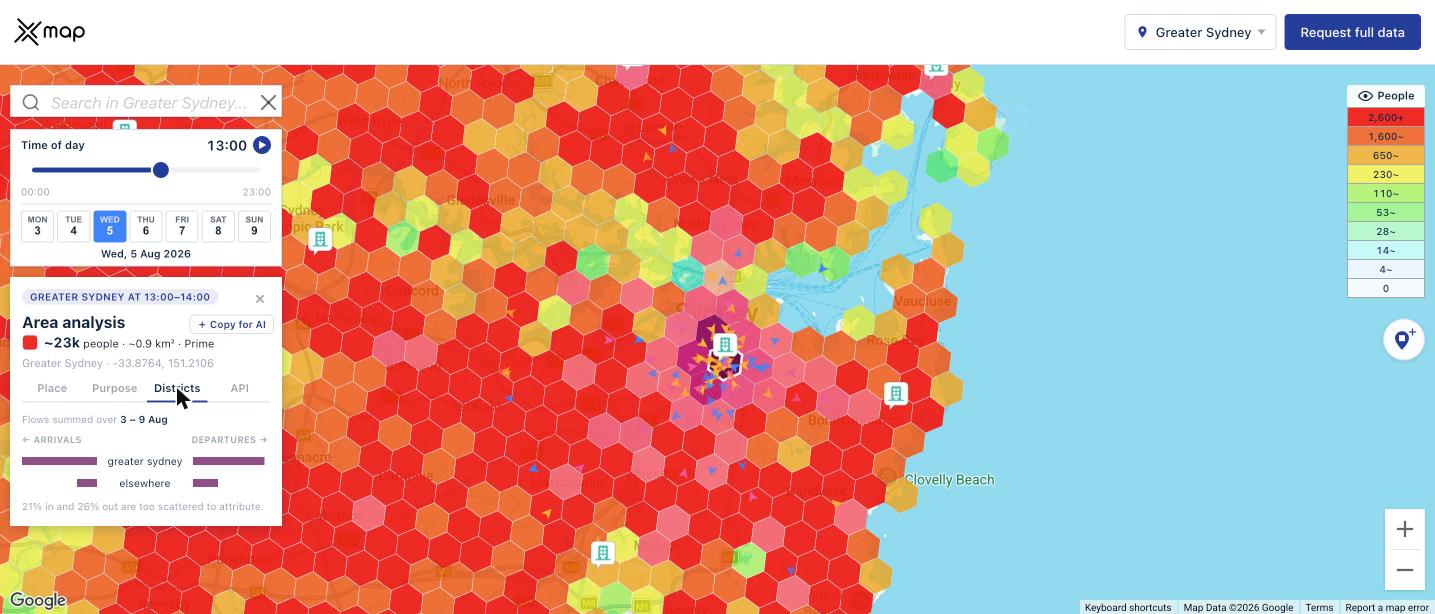
The sample point covering the southern CBD, at -33.8764, 151.2106:
- Around 23,000 people present at 1pm on Wednesday
- Busiest between 11am and midday, at roughly 31,986
- 33 percent of all daily activity happens in the morning
- Busier than 99 percent of cells in Greater Sydney
- 6,755 venues inside it: 1,848 offices, 332 restaurants, 512 retail, 106 bars, 495 education
Note the peak hour. This cell tops out between 11am and midday, not at 1pm. In our New York analysis, office-dense cells peaked at 1pm. In São Paulo, they peaked at 11am with a second peak at 5pm. Three cities, three different office rhythms. There is no universal lunchtime.
6. Sydney is a redistribution city, like São Paulo
Greater Sydney holds about 5.14 million people overnight and about 5.07 million at midday. The total moves by roughly one percent.
That puts Sydney with São Paulo rather than New York. Its data boundary is the Greater Sydney metropolitan area, which contains almost the whole commuter shed, so the city rearranges its people rather than importing them.
The flow view on the map makes the point directly. For the CBD hexagon, the overwhelming majority of both arrivals and departures come from and go to other parts of Greater Sydney. Only a small share is attributable to anywhere else, and roughly a fifth of arrivals and a quarter of departures are too dispersed to attribute to any single origin at all.
What three cities now show
São Paulo: a closed system that rearranges 840,000 people daily while its total stays flat.
New York: an open system that imports 700,000 people from beyond its own boundary, concentrated so tightly that ten hexagons absorb 16 percent of the gain.
Sydney: a closed system like São Paulo, but where the day of the week matters as much as the hour. Two adjacent working days differ by 13 percent in the CBD and 24 percent in North Sydney.
The common thread across all three is that resident population, the input most commercial decisions still rest on, describes none of it.
Method and limits
- Source: xMap footfall layer, H3 resolution 8, roughly 0.7 to 0.9 km² per cell
- Coverage: approximately 7,300 hexagons across Greater Sydney
- Period: Monday 3 to Sunday 9 August 2026, hourly, all seven days
- Monday is compromised. The NSW Bank Holiday fell on 3 August 2026. It closes banks and certain financial institutions but is not a general public holiday. In a finance-heavy CBD this depresses Monday by an unknown amount, so we excluded Monday from every comparison here.
- Values are banded. The public map returns population bands. We combined band edges across all 24 hours with each cell's relative hourly shape to narrow the estimate, then validated against the tool's own sample point panels.
- Individual cells are noisier than groups. Some single hexagons show day-to-day jumps that are artefacts of band boundaries rather than real movement. Every group-level figure here averages across hundreds of cells. Where we quote a single hexagon, we checked its full week for stability first and discarded cells that failed.
- Greater Sydney is a single administrative region in this dataset, with no suburb subdivisions. Location names in this article were derived from hexagon centroid coordinates, so read them as "the hexagon covering Parramatta" rather than as official suburb boundaries.
- Early August is Sydney winter. Cronulla's weekend pull would very likely be stronger in summer, so 1.34x should be read as a floor.
Try it on your own city
The map covers cities worldwide. Pick a hexagon, scrub the hour slider, and where a full week is available, switch days: footfall.xmap.ai
The public map shows bands and sample points. For exact hourly counts across any area, full city and country coverage, and daily and seasonal breakdowns, tell us what you need and the xMap team will follow up.

Subscribe for advanced Data analysis Tips and Reports

Get in Touch
Whatever your goal or project size, we will handle it.
We will ensure you 100% satisfication.
"We focus on delivering quality data tailored to businesses needs from all around the world. Whether you are a restaurant, a hotel, or even a gym, you can empower your operations' decisions with geo-data.”

