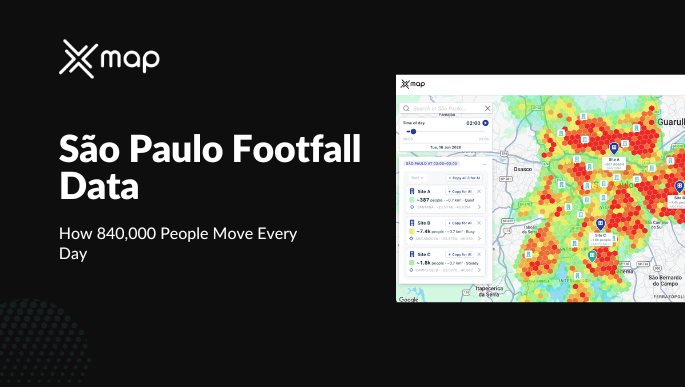
São Paulo Footfall Data: How 840,000 People Move Every Day | A Detailed Analyis Report
- Remove the current class from the content27_link item as Webflows native current state will automatically be applied.
- To add interactions which automatically expand and collapse sections in the table of contents, select the content27_h-trigger element, add an element trigger, and select Mouse click (tap).
- For the 1st click, select the custom animation Content 27 table of contents [Expand], and for the 2nd click, select the custom animation Content 27 table of contents [Collapse].
- In the Trigger Settings, deselect all checkboxes other than Desktop and above. This disables the interaction on tablet and below to prevent bugs when scrolling.
What 2,281 hexagons of hourly footfall data reveal about how a megacity actually works
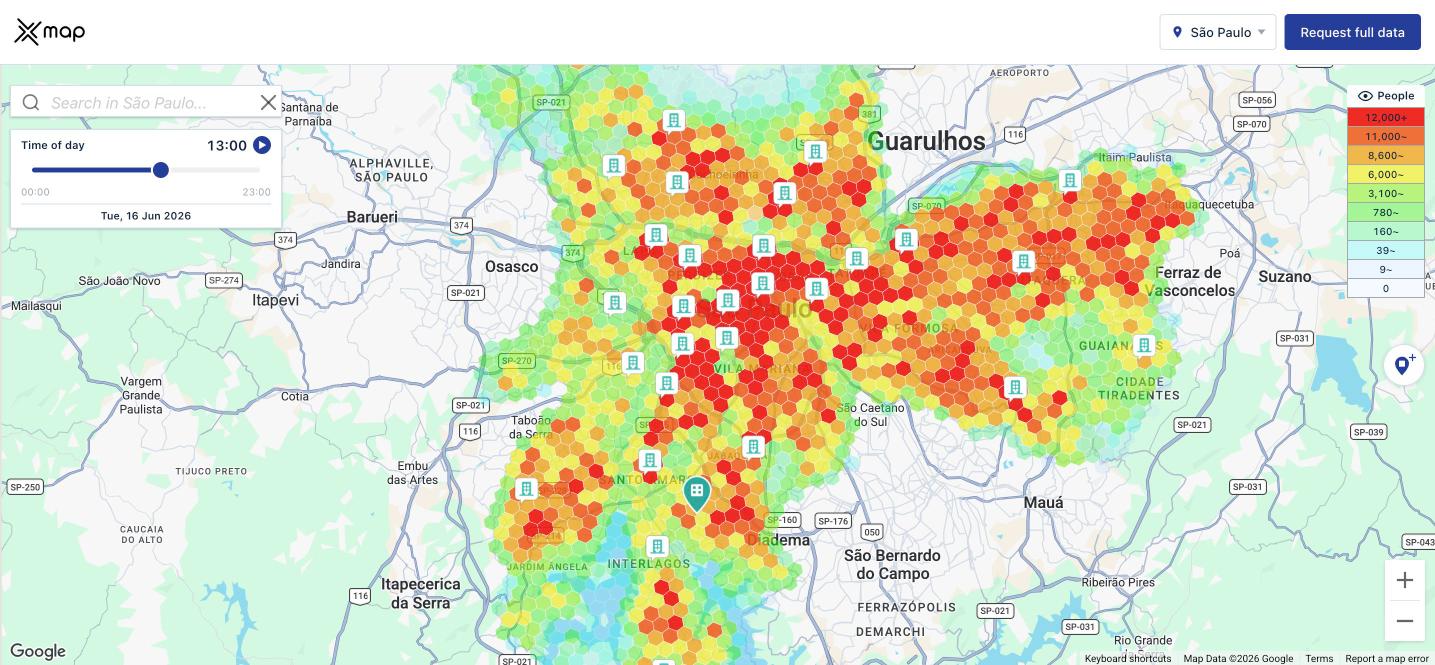
Ask most people what happens to São Paulo between 4am and 1pm and they will describe a city filling up. Offices open, shops raise their shutters, the streets get loud. The intuition is that the city grows.
The data says otherwise.
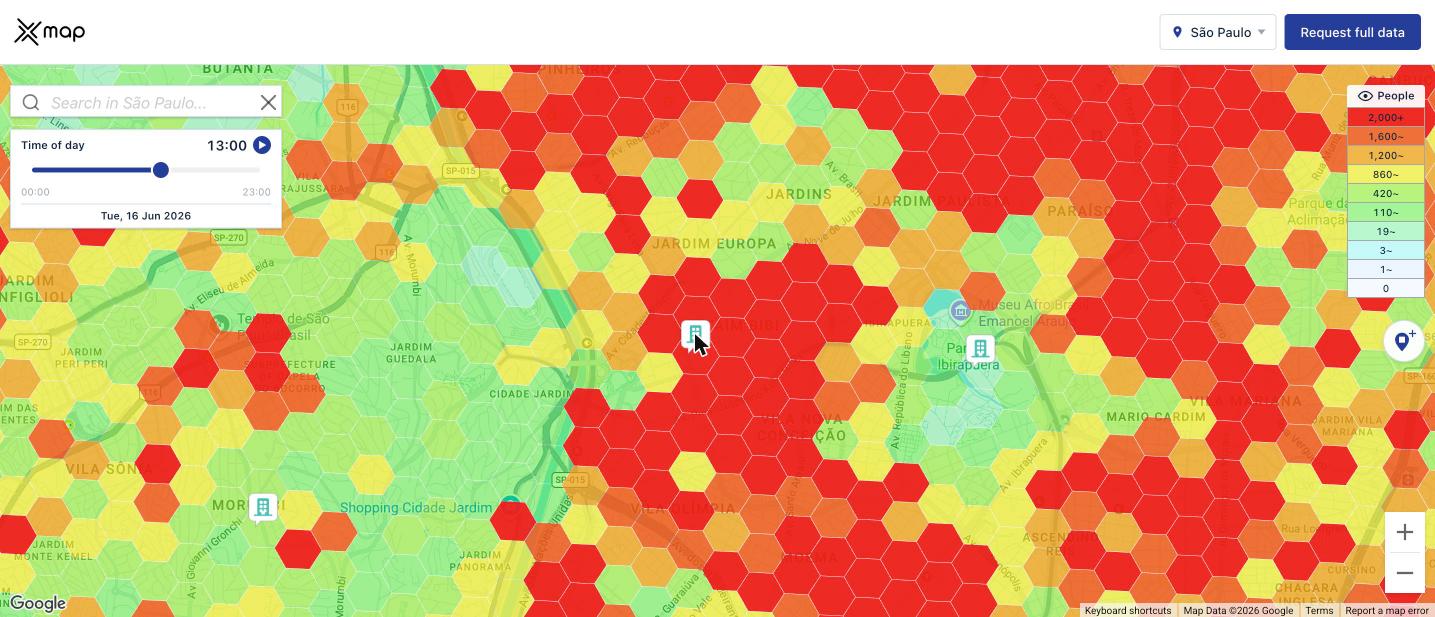
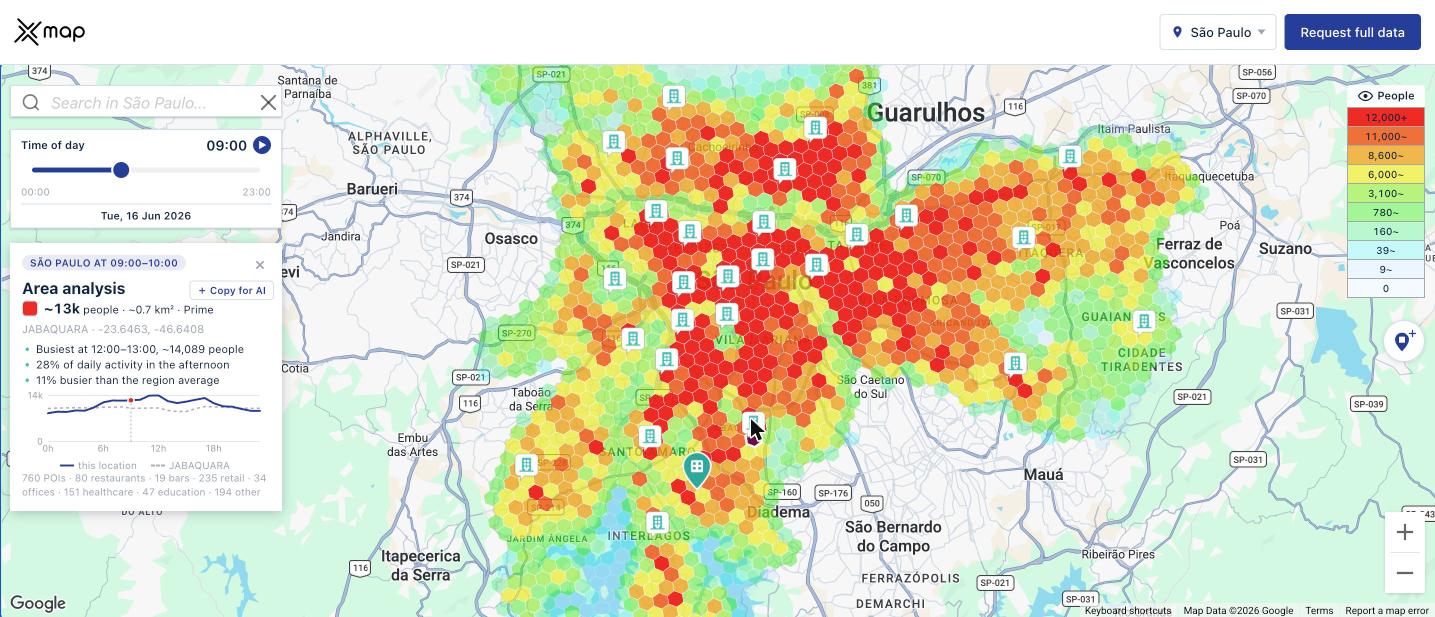
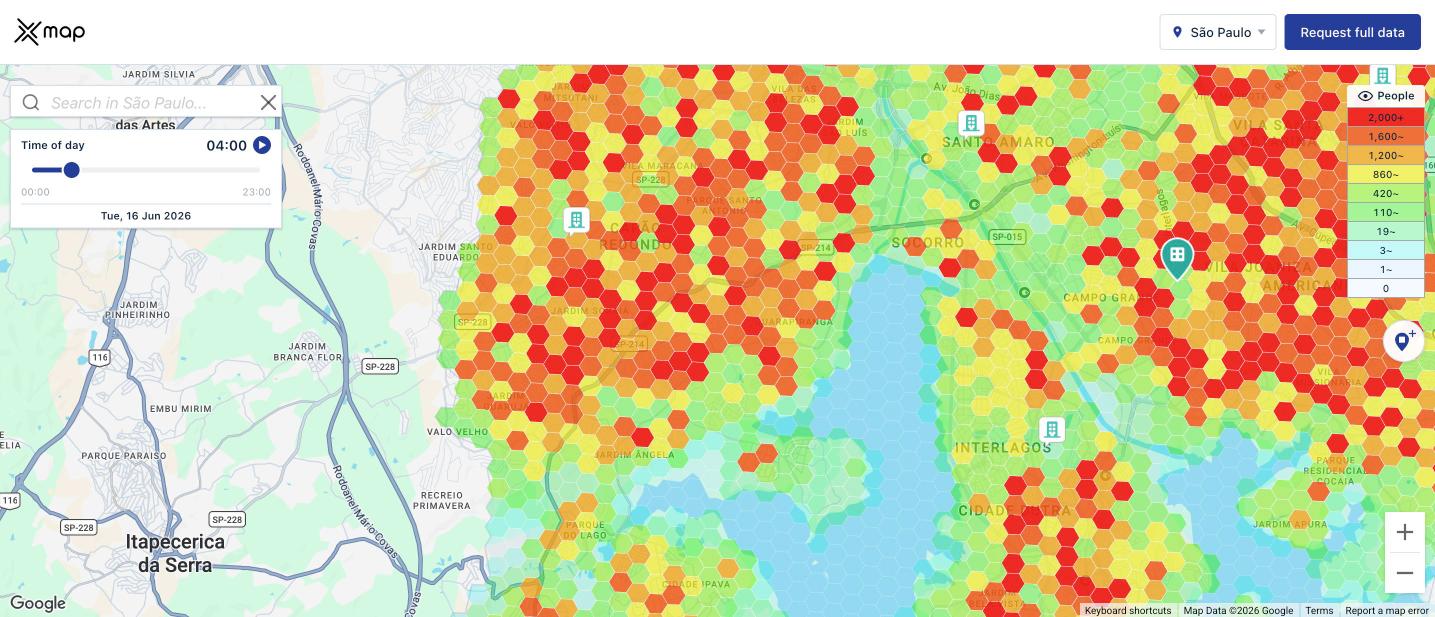
We pulled the hourly footfall layer behind the xMap Footfall Map for São Paulo: 2,281 H3 resolution 8 hexagons, roughly 0.7 km² each, covering all 96 districts of the municipality, with a people-present count for every hour of Tuesday, 16 June 2026.
Citywide, the number of people present barely moves. Around 11.4 million overnight. Around 10.9 million at midday. A swing of under 6 percent across the entire 24 hour cycle.
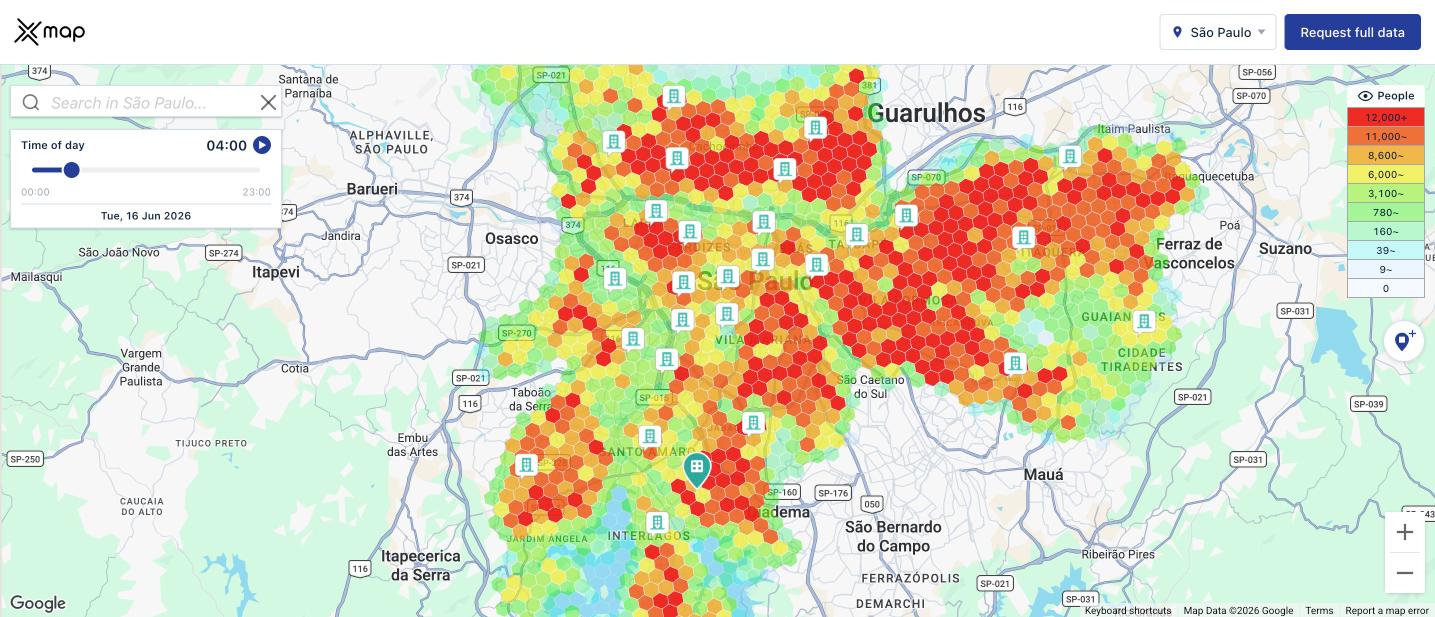
But underneath that flat total, roughly 840,000 people are standing somewhere completely different at 1pm than they were at 4am. The city does not expand. It redistributes. And the redistribution is the entire commercial story.
The same city, nine hours apart:
1. Some districts inhale. Others exhale.
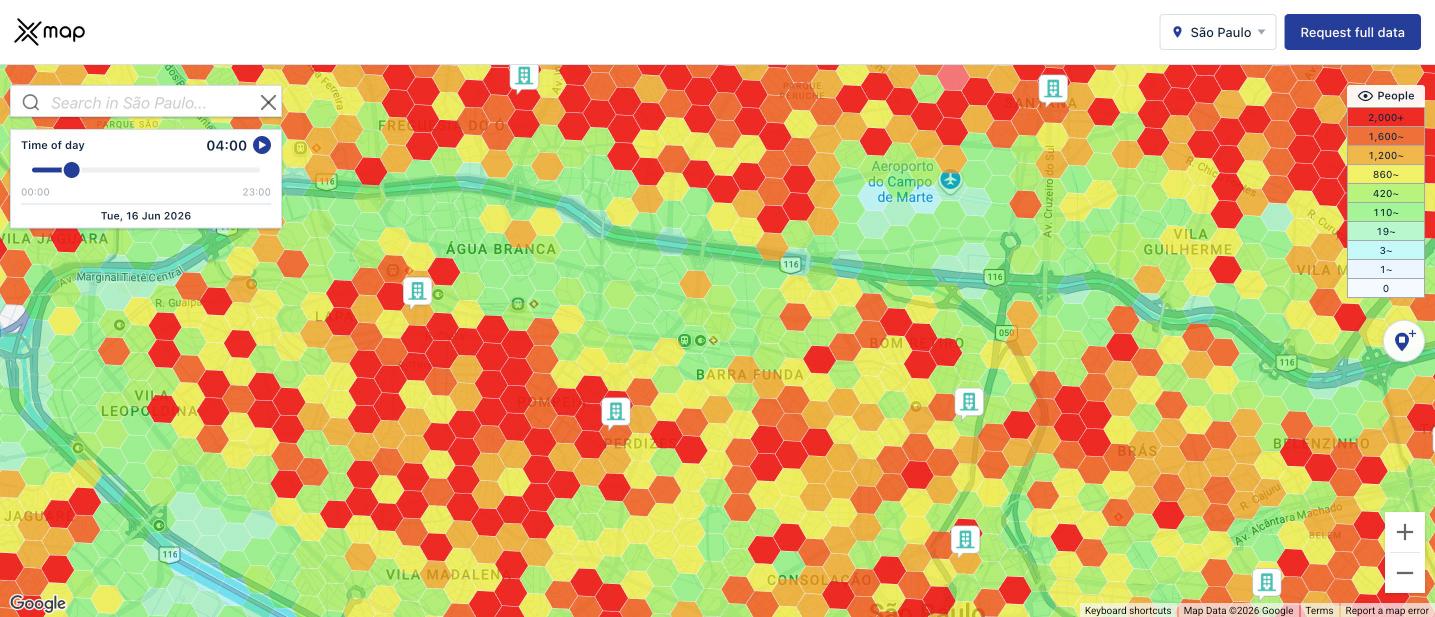
We calculated a simple daytime pull index for each district: average people present between 11:00 and 14:00, divided by the average between 01:00 and 05:00. Above 1.0 means the district imports people during the working day. Below 1.0 means it exports them.
Districts that inhale
Barra Funda is the clearest example of a district whose resident population tells you almost nothing useful about its commercial reality. Any decision keyed to census population, in either direction, is working from a number that is wrong for two thirds of the day.
Districts that exhale
The exhaling districts share a profile: peripheral, residential, and structurally dependent on transport links out. São Rafael and Jardim Ângela lose close to a quarter of their people by lunchtime.
2. Point of interest mix predicts the shape of the day
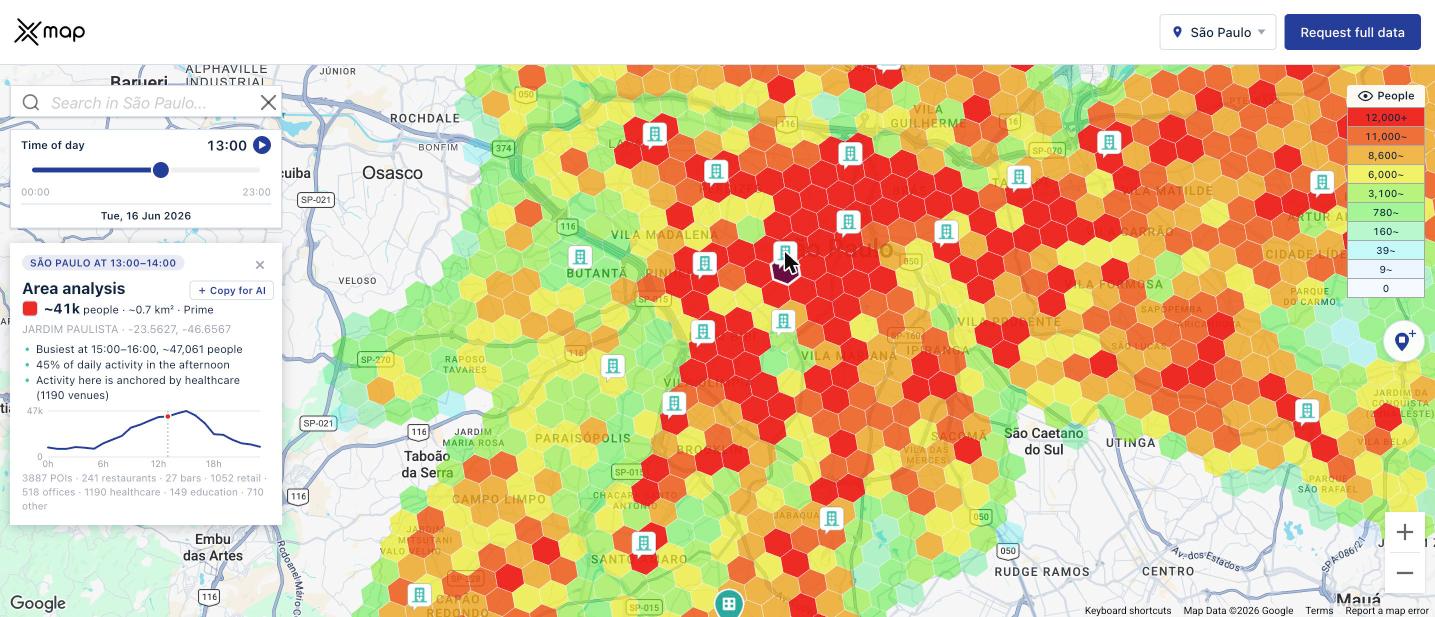
Every hexagon in the dataset carries a point of interest breakdown alongside its hourly curve: restaurants, bars, retail, offices, healthcare, education, transit, and more. That pairing lets you test whether what is built in a place actually predicts how the place behaves.
It does, and the separation is clean. Here is the average curve for each archetype, indexed to that group's own overnight baseline.
Three things worth flagging.
Office hexagons have two peaks, not one. The 17:00 reading of 1.29x is almost identical to the midday peak of 1.32x. That is the return commute and the after-work window stacking on top of each other. If you are planning staffing, delivery slots, or ad daypart weighting for a business in an office cluster, the 5pm hour is worth as much as noon.
Retail hexagons are flat, not peaked. Retail-dense areas hold a consistent 20 percent lift for a twelve hour stretch. That is a fundamentally different operating profile from an office cluster, and it argues for different lease economics, different labour scheduling, and different media pacing.
Logistics areas run on a different clock entirely. They are the only group already at 1.15x by 6am, an hour when the rest of the city is still asleep.
3. A metro station is worth about 33 percentage points of daytime footfall
Hexagons containing at least one metro station: 1.26x at midday, rising to 1.28x at 17:00.
Hexagons with no metro station: 0.93x.
That gap is not subtle. Metro-adjacent hexes are net importers of people, non-metro hexes are net exporters, and the two groups sit on opposite sides of the break-even line all day. In a city where 1,307 of the analysed hexes have no station and only 82 do, transit adjacency is one of the strongest single predictors of whether a location sees a working-day audience at all.
4. The centre does not empty at night. It changes who is in it.
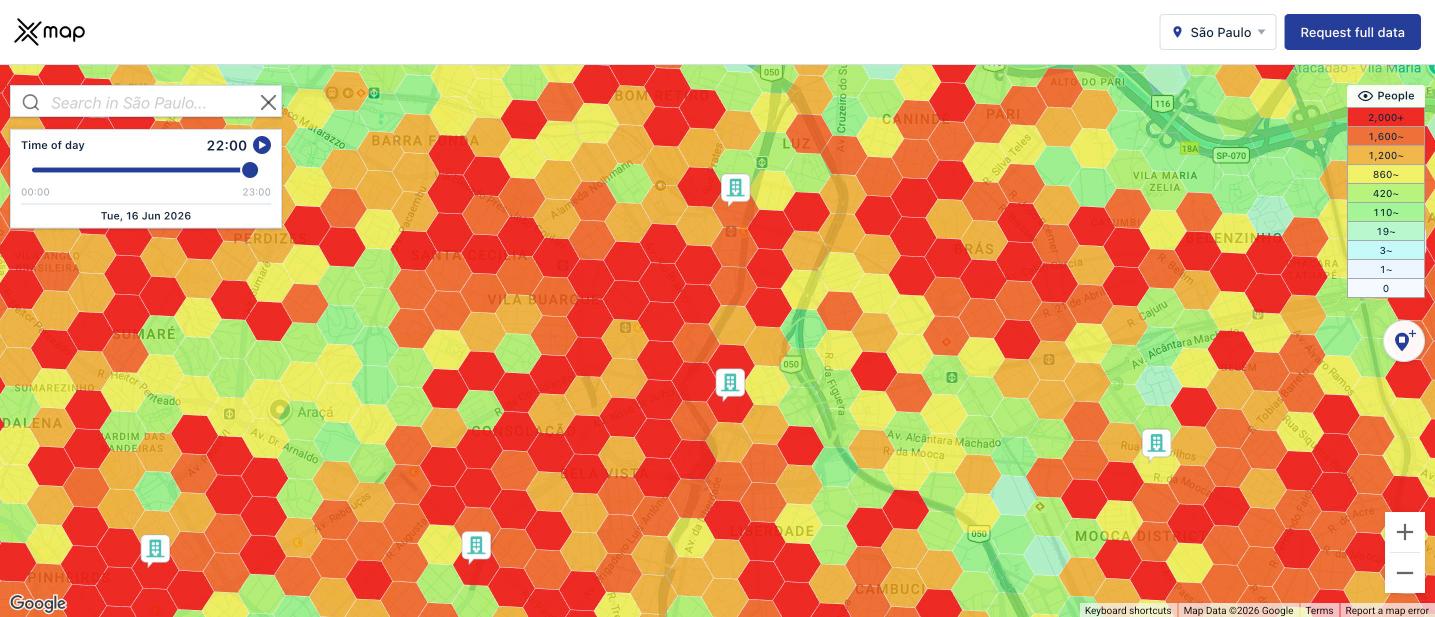
Ranking districts by evening index (20:00 to 22:00 against the overnight baseline) produces a different leaderboard from the daytime one:
República is the only district in São Paulo that is close to as busy at 9pm as it is at noon. For anyone planning late-trading retail, food service, security staffing, or out-of-home media, that list is the shortlist.
Worth noting: the dataset stops at 23:00, and nightlife-dense hexagons were still climbing when it did. The true evening peak in these districts sits outside this window.
5. The white space: places with the crowd but not the supply
The most actionable use of hourly footfall is finding mismatches, locations where demand shows up but supply has not.
We isolated the 177 hexagons that gain more than 2,000 people between overnight and midday, then divided midday population by the count of restaurants and cafés inside that hexagon.
The spread is enormous:
One Jardim Paulista hexagon takes in more than 2,100 additional people by lunchtime and contains six restaurants and one café. A Moema hexagon gains 3,270 people against twelve restaurants. These are not low-income or low-density areas. They are high-value catchments where the daytime population arrived and the food service supply did not follow.
That is a site selection list, generated from two data layers and no fieldwork.
6. What a single hexagon looks like up close
Take a Jabaquara hexagon at -23.6463, -46.6408:
- Around 13,000 people present at 09:00
- Busiest between 12:00 and 13:00, at roughly 14,089 people
- 28 percent of all daily activity happens in the afternoon
- 11 percent busier than the Jabaquara district average
- 760 points of interest inside it: 80 restaurants, 19 bars, 235 retail, 34 offices, 151 healthcare, 47 education
You now know when to open, when to staff up, what the competitive density is, and how this block compares to its own neighbourhood. For one hexagon, at one hour, anywhere in the city.
Why the flat citywide total is the most important finding
It is tempting to read 11.4 million overnight and 10.9 million at midday as a null result. It is the opposite.
A flat aggregate with violent internal redistribution is exactly the condition under which population-based decision making fails hardest. Census data, resident counts and district-level demographics all describe where people sleep. Almost every commercial decision, where to open, where to advertise, where to route, where to lease, depends on where people are at the hour that matters.
In São Paulo those two answers diverge by a factor of two in the districts where the money is.
Method and limits
- Source: xMap footfall layer, H3 resolution 8, roughly 0.7 km² per cell
- Coverage: 2,281 hexagons across 96 São Paulo districts
- Period: Tuesday, 16 June 2026, hourly from 00:00 to 23:00
- Values are banded. The public map returns population bands rather than exact counts. We used band midpoints, so figures are directional, not precise.
- The top band is open-ended. The densest hexagons are censored at the top of the scale, so the daytime gains reported for Itaim Bibi, Santo Amaro and Bom Retiro are understated, not overstated. Sample points on the same map return far higher exact counts than the banded layer can express.
- One weekday. Weekend, seasonal and event-driven patterns will differ, and in nightlife districts they will differ a lot.
- The day ends at 23:00, before the evening peak in the nightlife districts.
Try it on your own city
The map covers cities worldwide. Pick a hexagon, scrub the hour slider and watch the curve change: footfall.xmap.ai
The public map shows bands and sample points. For exact hourly counts across any area, full city and country coverage, and daily and seasonal breakdowns, tell us what you need and the xMap team will follow up.

Subscribe for advanced Data analysis Tips and Reports

Get in Touch
Whatever your goal or project size, we will handle it.
We will ensure you 100% satisfication.
"We focus on delivering quality data tailored to businesses needs from all around the world. Whether you are a restaurant, a hotel, or even a gym, you can empower your operations' decisions with geo-data.”

