New York Footfall Data: The City Gains 700,000 People by 3pm

- Remove the current class from the content27_link item as Webflows native current state will automatically be applied.
- To add interactions which automatically expand and collapse sections in the table of contents, select the content27_h-trigger element, add an element trigger, and select Mouse click (tap).
- For the 1st click, select the custom animation Content 27 table of contents [Expand], and for the 2nd click, select the custom animation Content 27 table of contents [Collapse].
- In the Trigger Settings, deselect all checkboxes other than Desktop and above. This disables the interaction on tablet and below to prevent bugs when scrolling.
We ran the same hourly footfall analysis on New York that we ran on São Paulo. The two cities behave nothing alike.
When we mapped São Paulo hour by hour, the finding was that the city does not grow during the day. It holds roughly 11 million people around the clock and simply rearranges them. The total was flat. Only the distribution moved.
We expected New York to look similar. It does not.
New York gains roughly 700,000 people between 4am and its afternoon peak. Not redistributed. Added.
The city holds about 8.08 million overnight and 8.78 million at 3pm, an 8.6 percent increase. That is a genuinely different physics, and it comes down to a boundary: São Paulo's data covers a municipality that is close to self-contained, while New York's five boroughs sit inside a commuter shed that reaches into New Jersey, Westchester and Long Island. Every morning the city imports a mid-sized city's worth of people from outside its own edges.
Here is what that looks like, and what it means if you are choosing where to put something.
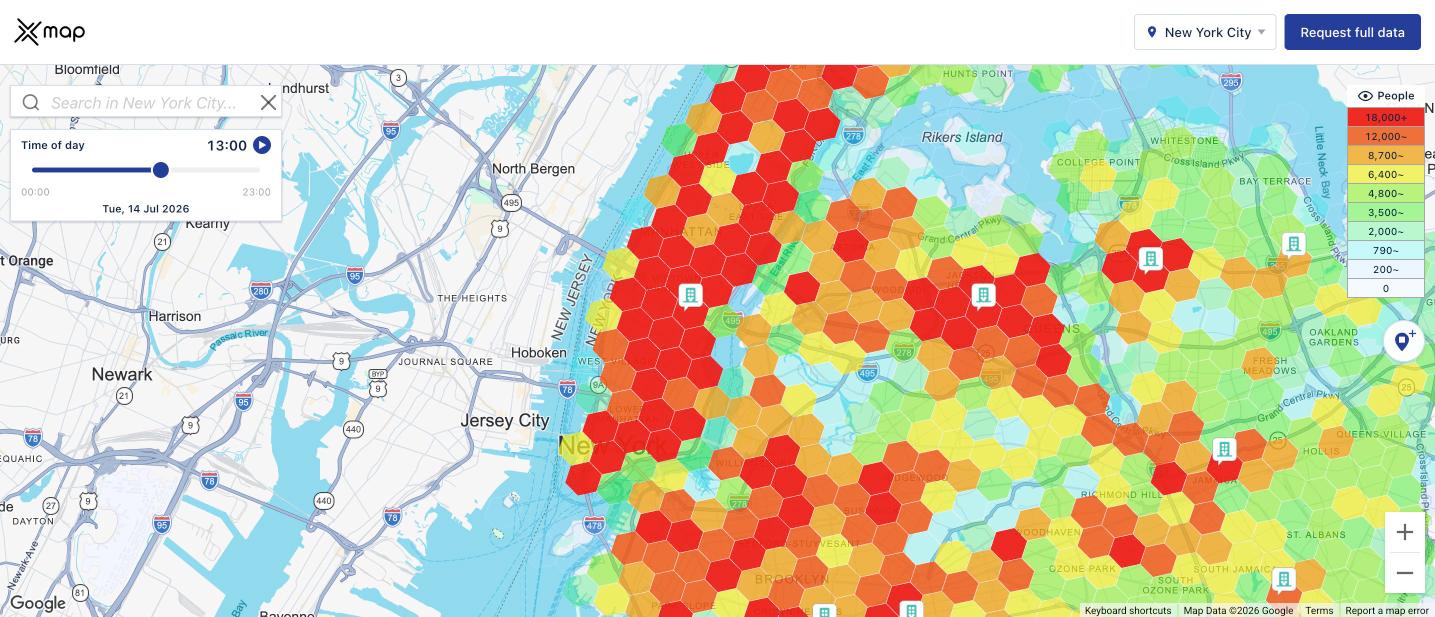
The same city, nine hours apart:
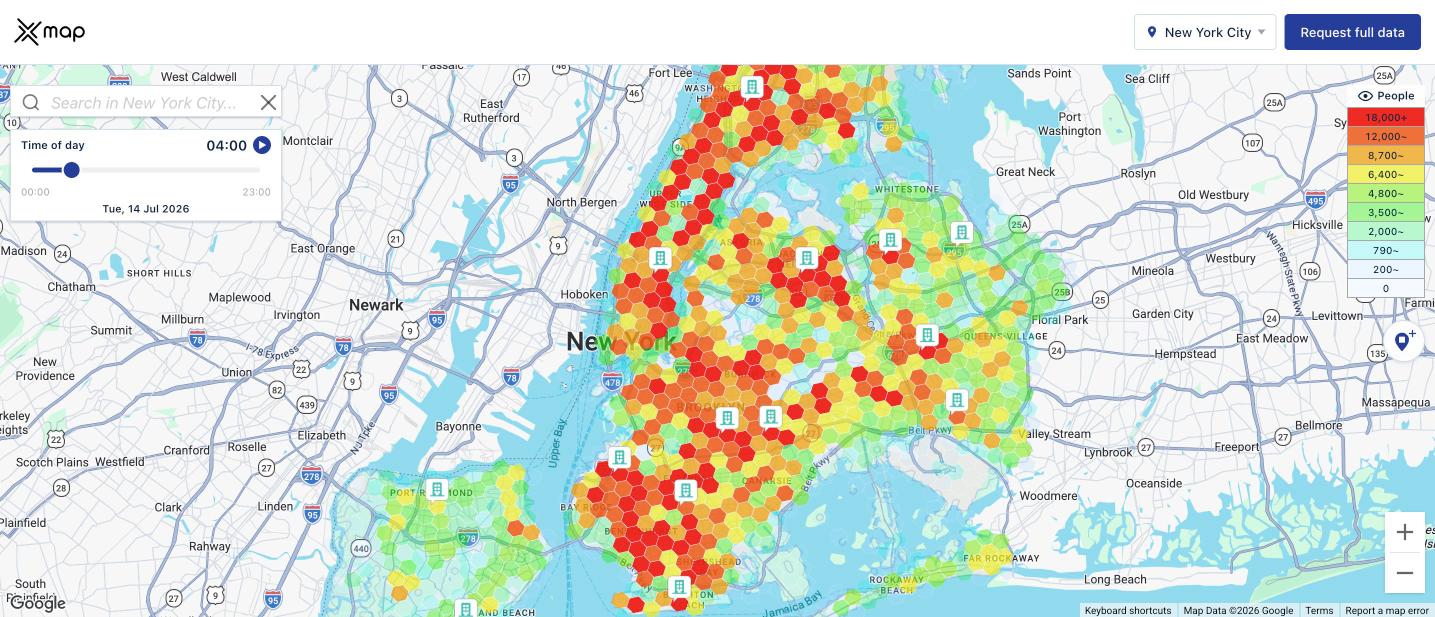

Methodology in brief: 1,219 H3 resolution 8 hexagons, roughly 0.7 km² each, across 234 New York neighbourhoods, with a people-present count for every hour of Tuesday, 14 July 2026. Same method, same cell size, same weekday as the São Paulo analysis, so the two are directly comparable.
1. The gain is extraordinarily concentrated
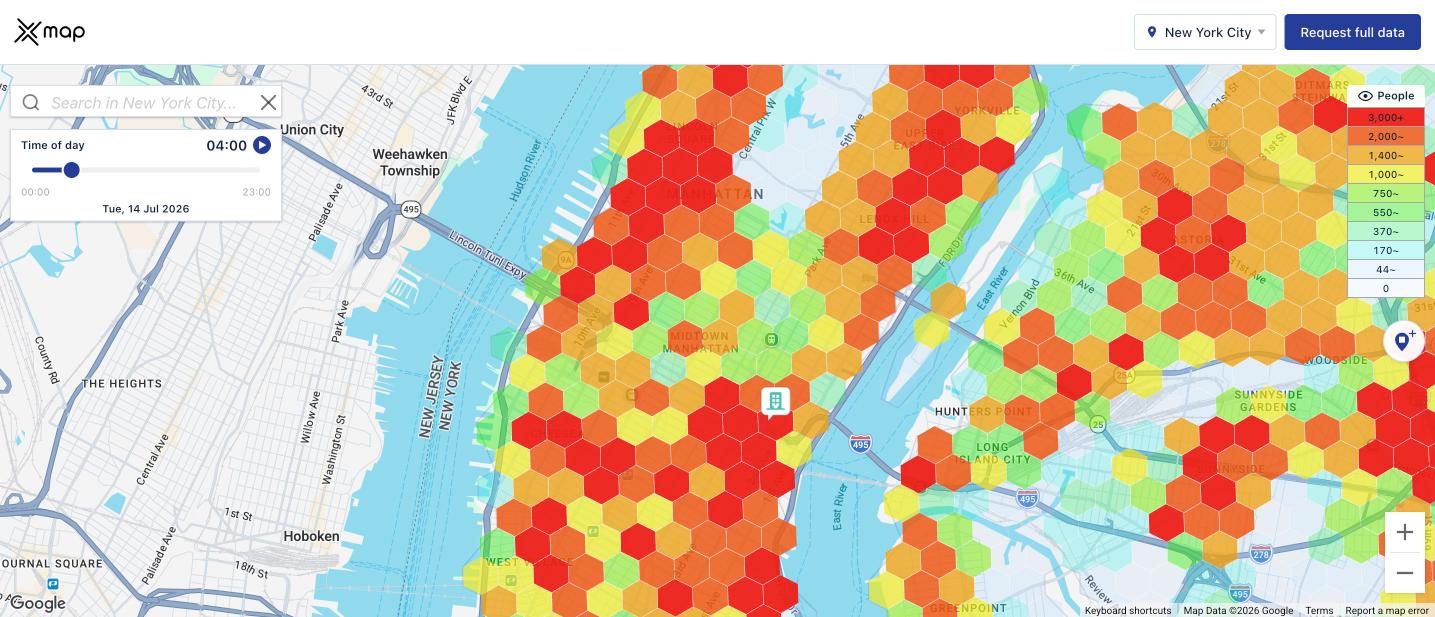

Of 1,219 hexagons, 705 gain people by midday. But the distribution is nothing like even.
The top ten hexagons absorb 16 percent of the entire city's daytime gain. The top twenty five absorb 29 percent. Ten cells, covering about seven square kilometres, take in more than 200,000 people.
Ranked by daytime pull index, which is average midday population divided by average overnight population:
By comparison, São Paulo's single biggest gainer was Barra Funda at 1.96x. New York's top four all exceed it, and Midtown-Times Square is in a category of its own.
At the other end:
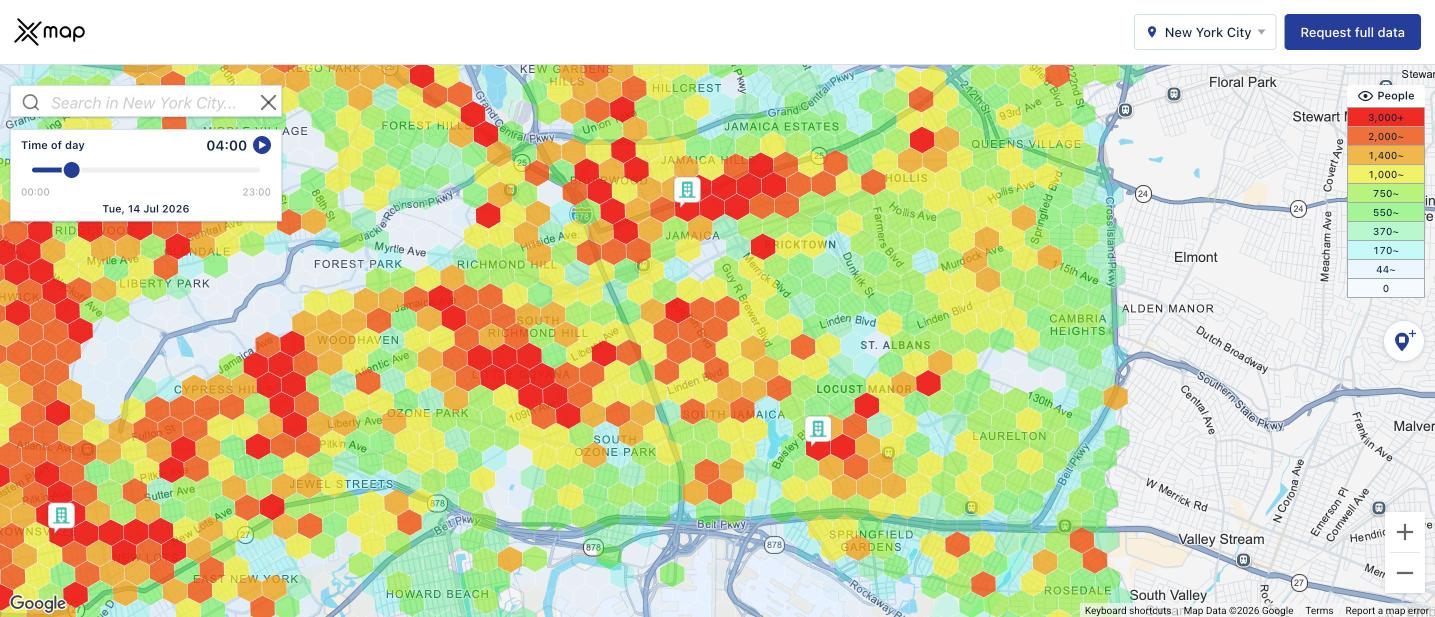
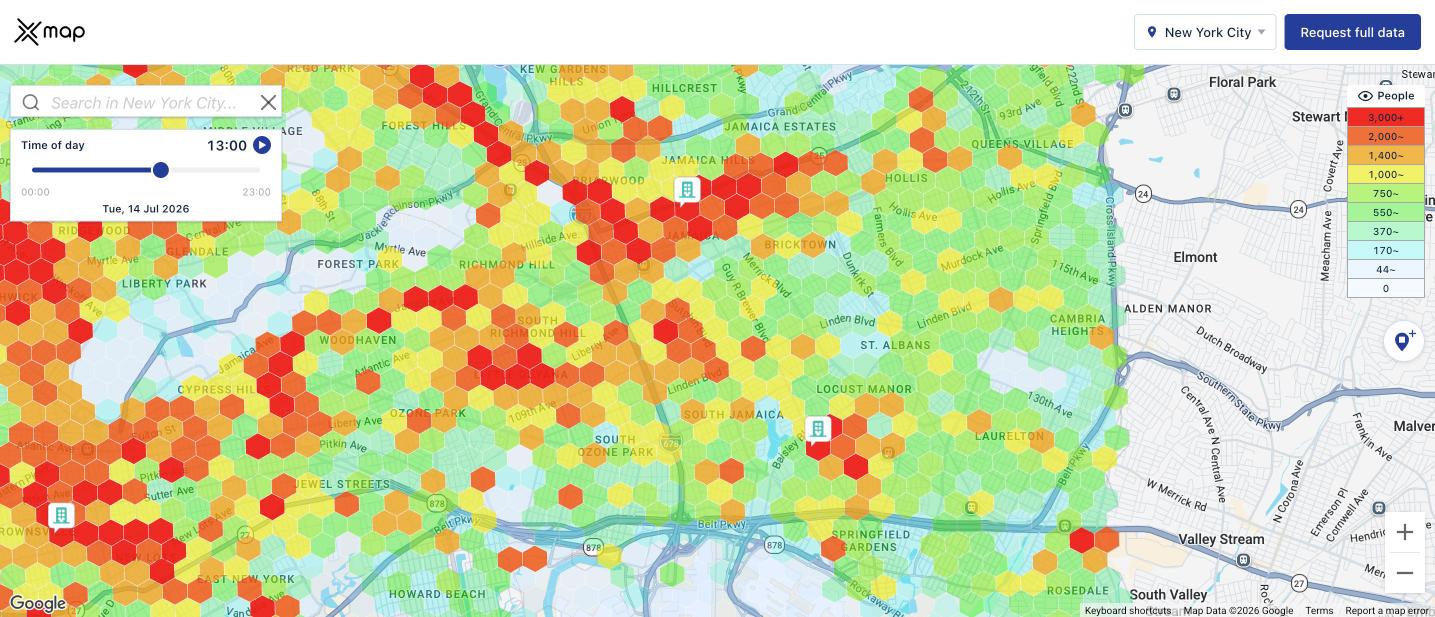
Corona loses nearly 11,000 people by lunchtime. South Jamaica loses 8,300. These are the origin end of the flows filling Midtown.
2. The subway effect is a dose response, not a yes or no
This is the finding that surprised us most, and it is much sharper in New York than it was in São Paulo.
We grouped hexagons by how many subway stations they contain:
Read the zero-station line again, because it is the striking one. Averaged across 642 hexagons, a New York neighbourhood without a subway station does not change size during the day. Not slightly. At all. Its curve is a straight line from midnight to midnight.
Station count is not really measuring transit here. It is measuring how many independent flows of people a place can receive. One station connects you to a line. Three connects you to a network, and the daytime population climbs by 71 percent.
For site selection this is close to a free filter. Before looking at rent, demographics, or competitive density, count the stations. In New York it separates locations that have a daytime audience from locations that structurally cannot.
3. Two hexagons, same size crowd, opposite clocks
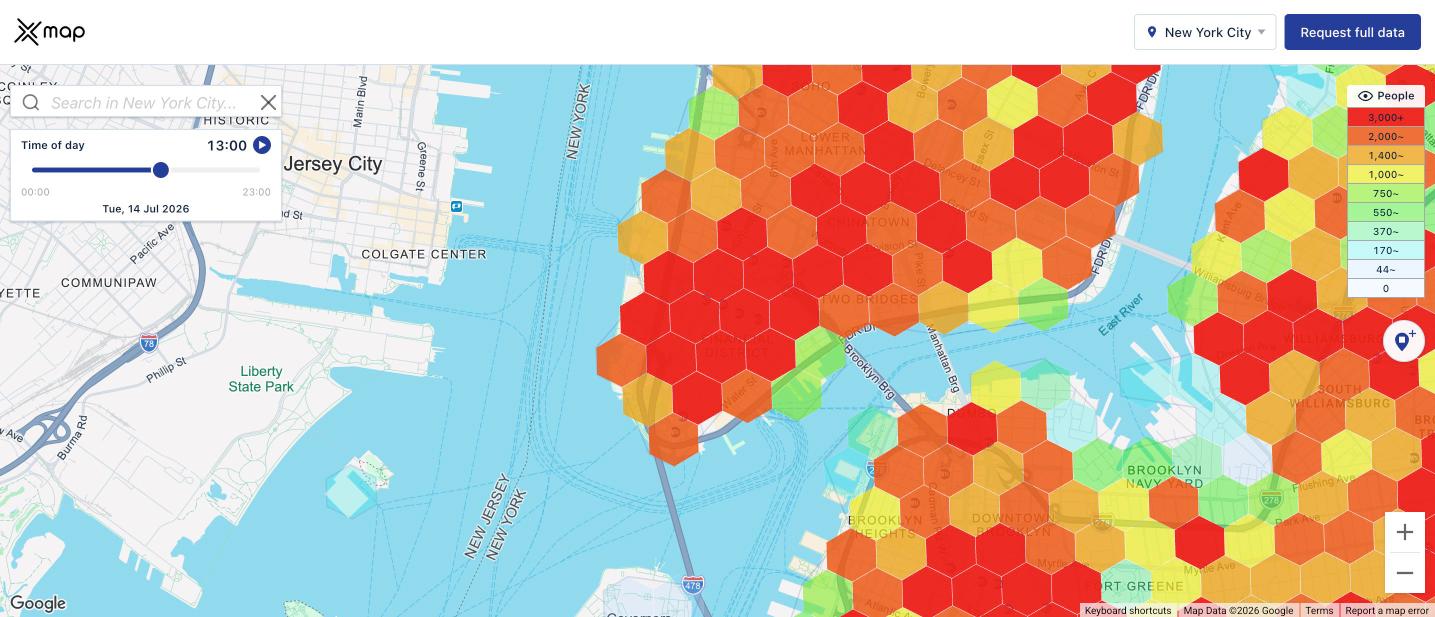
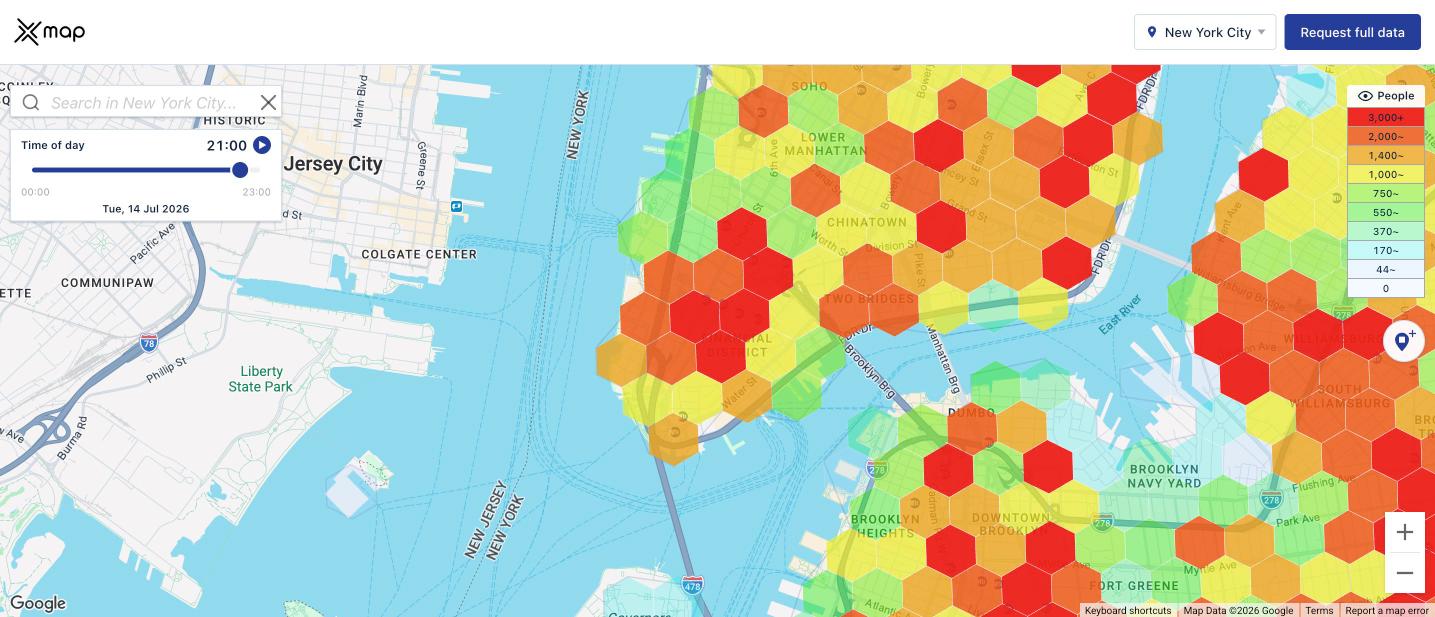
The clearest illustration of why resident population is the wrong input sits in two cells with almost identical midday headcounts.
Murray Hill-Kips Bay, 0.7 km²: around 47,000 people at 1pm. Busiest between 1pm and 2pm at roughly 46,800. 30 percent of all daily activity falls in the afternoon. Inside it: 10,506 venues, including 1,998 offices, 3,590 healthcare locations, 274 restaurants and 38 bars.
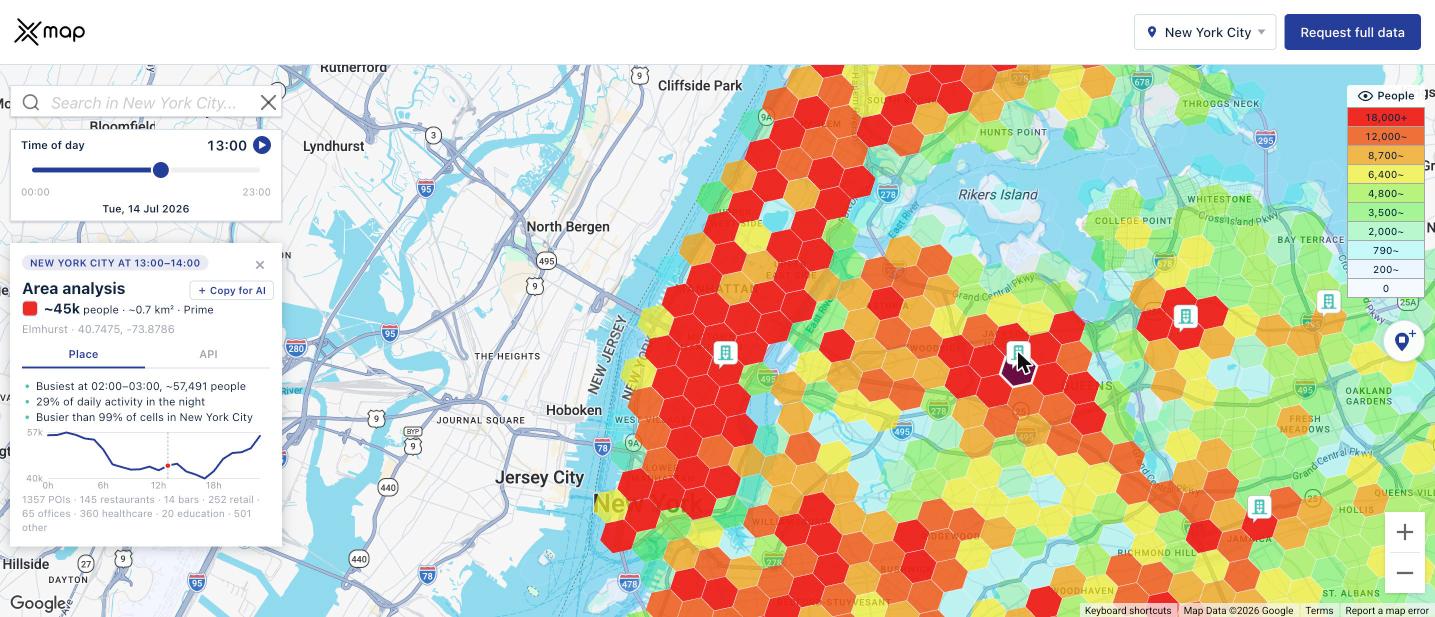
Elmhurst, 0.7 km²: around 45,000 people at 1pm. Busiest between 2am and 3am at roughly 57,500. 29 percent of all daily activity falls at night. Inside it: 1,357 venues, including 65 offices, 145 restaurants and 14 bars.
Both are busier than 99 percent of cells in New York. A census would show two dense neighbourhoods. A midday footfall snapshot would show two similar crowds.
They are opposite businesses. One is a weekday lunch and office services market that empties every evening. The other is a residential market whose population is at home and at its peak while Murray Hill is deserted. Identical numbers, incompatible operating models.
4. Venue mix predicts the curve, and New York's office peak is single, not double
Grouping hexagons by what is built inside them, indexed to each group's own overnight baseline:
Two contrasts with São Paulo are worth drawing out.
São Paulo's office districts have two peaks. New York's have one. In São Paulo, the 5pm reading was 1.29x against a midday peak of 1.32x, effectively a tie, because the return commute and the after-work window stack. In New York, office hexagons hit 1.48x at 1pm and fall to 1.30x by 5pm and 1.07x by 7pm. The crowd arrives harder and leaves faster.
New York's nightlife-dense areas peak at lunchtime. Their evening index is 1.04x. This is not because New York lacks nightlife. It is because bar-dense hexagons in Manhattan are also office-dense and retail-dense, and the daytime crowd simply dwarfs the evening one in raw headcount. Bar density does not identify a nightlife district here. It identifies a mixed-use district that also has bars.
5. New York empties early, with one exception
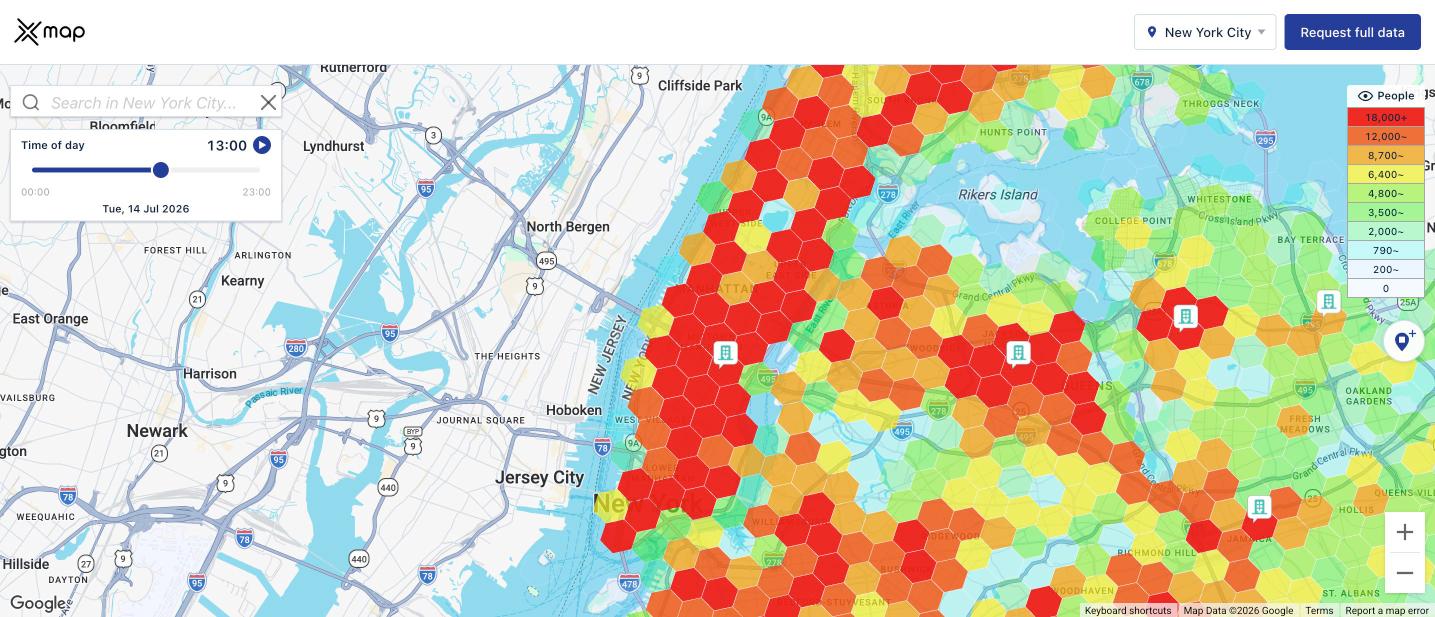
Across every venue archetype we tested, New York's evening index lands between 1.02x and 1.07x. By 8pm the city as a whole is essentially back to its overnight baseline.
São Paulo does not do this. República sits at 1.46x in the evening and Sé at 1.41x, close to their midday levels.
New York has exactly one district that behaves that way, and it is not the one you would guess:
The Financial District has the highest evening index in New York, higher than Greenwich Village and higher than Times Square. A decade of office-to-residential conversion has produced a district that gains people during the working day like a business district and holds them into the evening like a neighbourhood. On this measure it is the most genuinely mixed-use district in the city.
If you are planning late-trading retail, evening food service, or out-of-home media, that ranking is the shortlist, and it is not the one most media plans assume.
6. The white space: where the crowd arrives and nobody feeds it
We isolated the 112 hexagons that gain more than 3,000 people between overnight and midday, then divided midday population by the number of restaurants and cafés inside each one.
The gap between the best and worst served hexagons is roughly fifty-fold. Some of these are genuine underprovision. Some reflect food service that sits just outside the hexagon boundary. All of them are worth an afternoon of someone's attention, and none of them show up in a resident-population analysis.
What the two cities together actually demonstrate
São Paulo's lesson was that a flat citywide total can conceal enormous internal movement, and that census population misleads you in both directions.
New York's lesson is different and in some ways more uncomfortable: the daytime population is not just differently distributed, it is larger, and the surplus lands in a handful of cells. Ten hexagons out of 1,219 absorb 16 percent of it.
Put together, the point is that "how many people live here" and "how many people are here" are two unrelated questions, and only one of them is on the map you are probably using.
Method and limits
- Source: xMap footfall layer, H3 resolution 8, roughly 0.7 km² per cell
- Coverage: 1,219 hexagons across 234 New York neighbourhoods
- Period: Tuesday, 14 July 2026, hourly from 00:00 to 23:00
- Values are banded. The public map returns population bands rather than exact counts. We combined band edges with the relative hourly shape to estimate values, so figures are directional, not precise.
- The top band is open-ended at 18,000 and above, so gains in the densest Manhattan cells are understated rather than overstated.
- Mid-July is not a neutral week. Summer means peak tourism and reduced office attendance at the same time. Midtown and the Financial District figures should be read as a summer weekday, not an annual average.
- The boundary matters. The dataset covers the five boroughs. The commuter origins in New Jersey, Westchester and Long Island sit outside it, which is why the citywide total is not conserved.
- One weekday. Weekend and seasonal patterns differ, and in nightlife districts they differ substantially.
Try it on your own city
The map covers cities worldwide. Pick a hexagon, scrub the hour slider and watch the curve change: footfall.xmap.ai
The public map shows bands and sample points. For exact hourly counts across any area, full city and country coverage, and daily and seasonal breakdowns, tell us what you need and the xMap team will follow up.

Subscribe for advanced Data analysis Tips and Reports

Get in Touch
Whatever your goal or project size, we will handle it.
We will ensure you 100% satisfication.
"We focus on delivering quality data tailored to businesses needs from all around the world. Whether you are a restaurant, a hotel, or even a gym, you can empower your operations' decisions with geo-data.”

