Saudi Arabia Riyadh Grid Aggregation Dataset

Examine the energy dynamics of Riyadh's electric grid with our comprehensive dataset. Essential for energy analysts, policy makers, and urban planners.

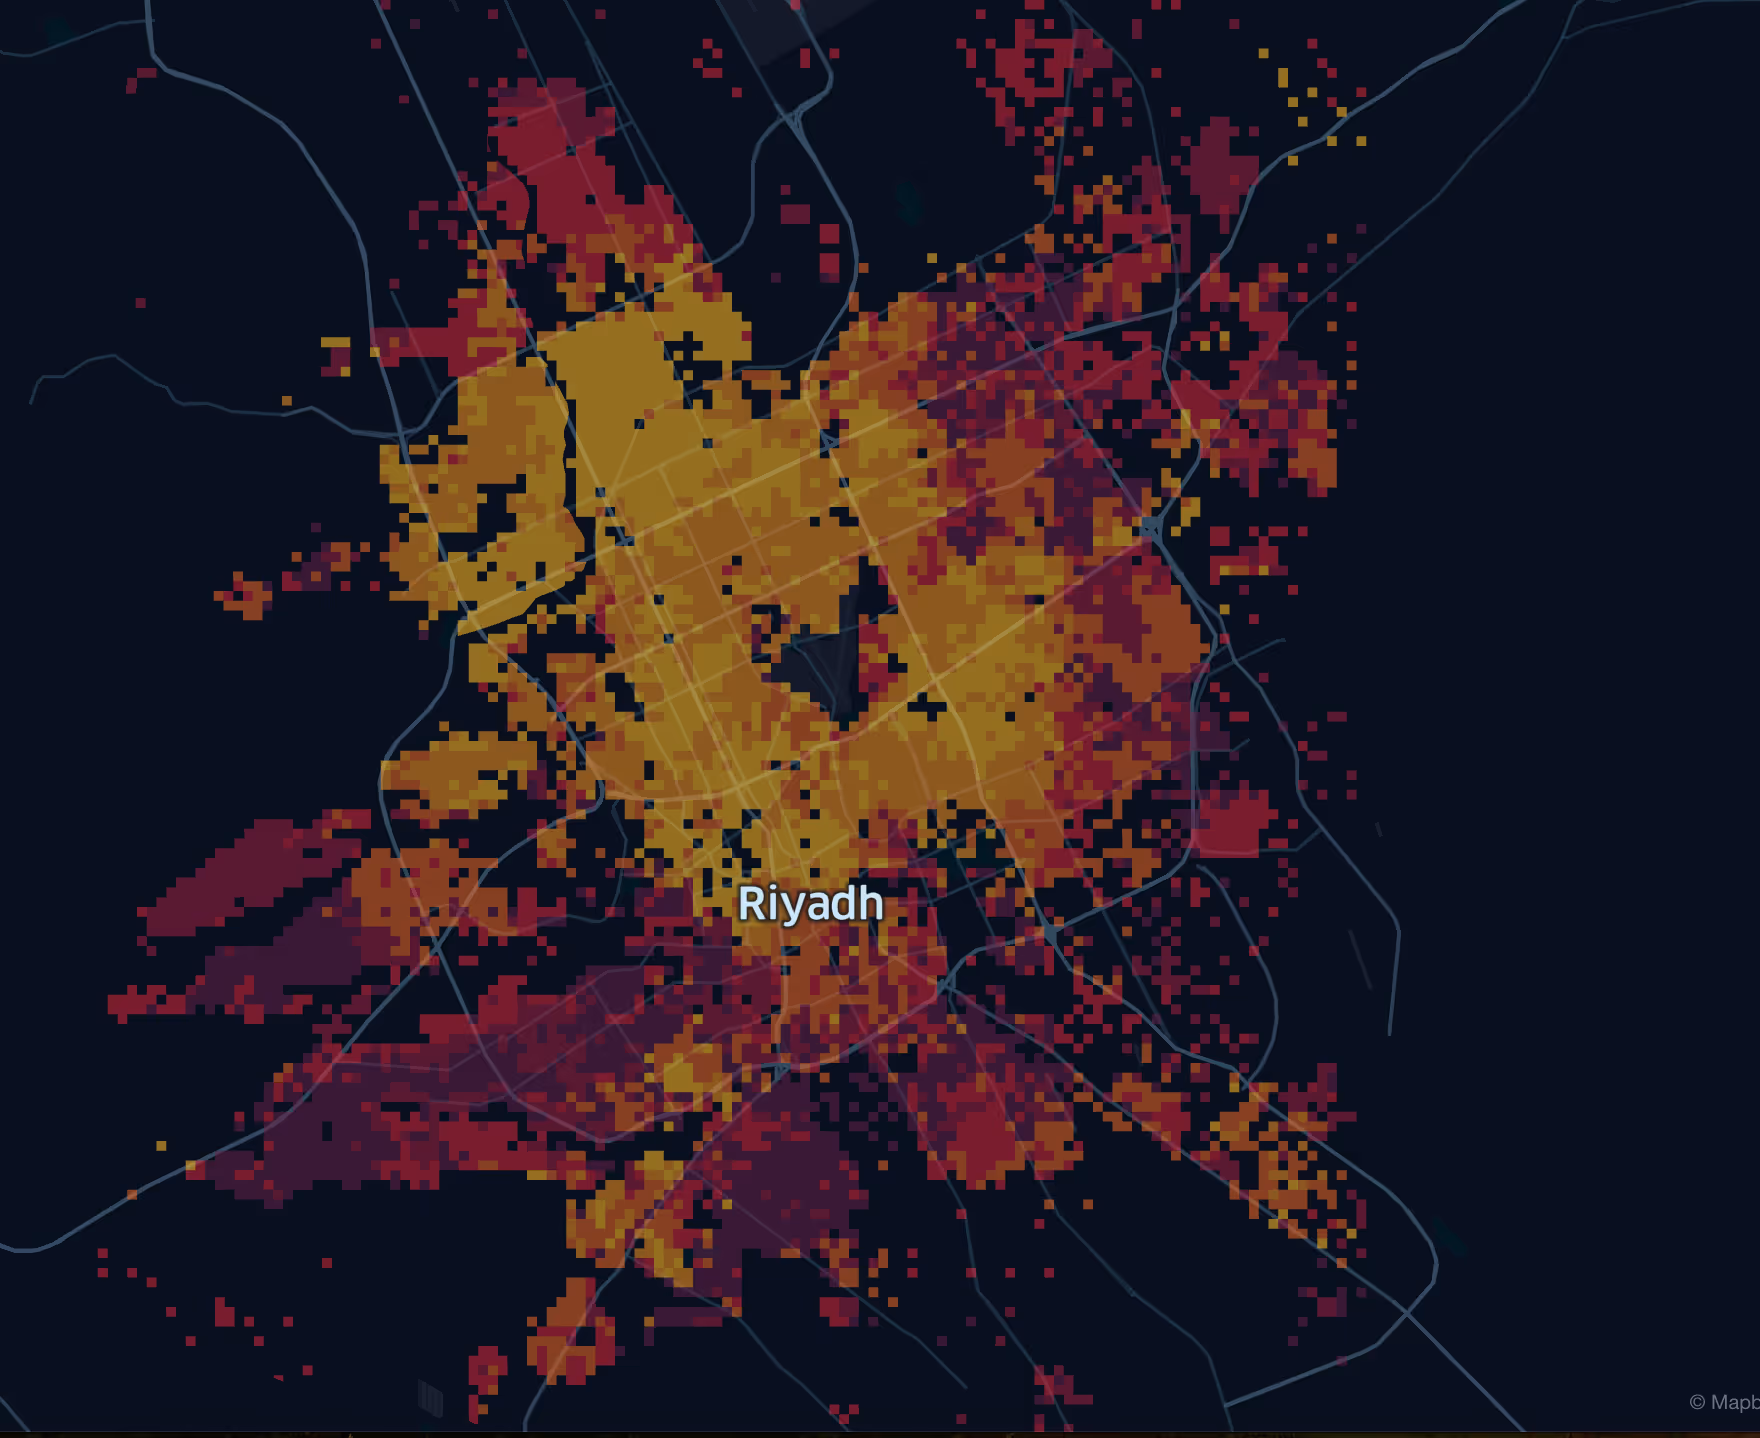
Riyadh's Electric Grid Analysis - Energy Consumption and Production

Get an in-depth understanding of Riyadh's electric grid. Our dataset offers essential data on energy consumption, production trends, and regional energy distribution, key for energy management and policy development.

7922

Total Number of records
Sign Up for Free

Increased by 4.23% year-on-year

Yearly Increase in Energy Consumption
Sign Up for Free

31% (Western Region) - 30% (Central Region)

Regional Energy Consumption Distribution
Sign Up for Free

7676

Grocery Stores > 10
Sign Up for Free

Download a Sample of the Saudi Arabia Riyadh Grid Aggregation Dataset

Explore key energy consumption and production data in Riyadh's electric grid. Our sample dataset provides insights into regional energy distribution and trends, valuable for strategic energy planning.

Key Variables

Get an in-depth understanding of Riyadh's electric grid. Our dataset offers essential data on energy consumption, production trends, and regional energy distribution, key for energy management and policy development.

Name
Description
Type
gas_stations_count
Count of gas stations within the area
Integer
mean_transaction_area
Average area of the properties transacted
Float
mean_cost_per_meter
Average cost per square meter in property transactions
Float
score
General score based on multiple factors (could be livability, safety, etc.)
Float
mean_transaction_price
Average price of the properties transacted
Float
transaction_count
Count of transactions (could be sales or rentals) in the area
Integer
sum_other_dwellings
Number of dwellings not included in other categories
Integer
sum_community_commercial_buildings
Total number of commercial buildings for community use
Integer
sum_workspace_commercial_buildings
Total number of commercial buildings used as workspaces
Integer
sum_public_commercial_buildings
Total number of public commercial buildings
Integer
sum_rented_residential_houses
Number of rented residential houses
Integer
sum_other_residential_houses
Number of residential houses under other forms of tenure
Integer
sum_privately_owned_residential_houses
Number of privately owned residential houses
Integer
sum_owned_residential_houses
Number of owned residential houses
Integer
sum_commercial_dwellings
Number of commercial dwellings in the area
Integer
sum_residential_dwellings
Number of residential dwellings in the area
Integer
sum_total_dwellings
Total number of dwellings in the area
Integer
mean_median_age
Mean median age of the population in the area
Float
geo_level
Level of geographic aggregation or detail
String
sum_total_population
Total population within the area
Integer
mean_population_density
Average density of the population in the area
Float
lng
Longitude coordinate for the geographic location
Float
lat
Latitude coordinate for the geographic location
Float
sequence
Order in a sequence or series
Integer
record_id
Unique identifier for the data record
String
place_id
Identifier for the place as per a given system
String
most_appeared_tags
Tags that occur most frequently in the area's data
String
average_reviews_no
Average number of reviews for the listed services or locations
Integer
traffic_score
Score indicating the level of traffic in the area
Float
average_price_range
The common price range across services or products
String
geo_id
Unique identifier for a geographic location
String
groceries_count
Total number of grocery stores within the area
Integer
average_rate
Average rating for a service or location
Float

Use Cases

How can this dataset benefit you?

Energy Demand Forecasting

Utilize the dataset for accurate forecasting of energy demand, aiding in efficient grid management and resource allocation.

Urban Infrastructure Planning

Leverage this dataset in urban planning and infrastructure development, ensuring alignment with energy consumption trends.

Policy Development

Employ the dataset for data-driven policy making in energy distribution and conservation strategies.

Yearly Increase in Energy Consumption

Saudi Arabia’s electrical energy consumption increased by 4.23% year-on-year to 301,600 GWh in 2021, reflecting a steady growth in energy demand​​.

Regional Energy Consumption Distribution

In Saudi Arabia, the Western Region accounted for the largest share of electrical energy consumption with 93,920 GWh (31%), followed closely by the Central Region with 91,470 GWh (30%)​​.

Why xMap?

xMap empowers businesses with unparalleled location intelligence and comprehensive data analysis, guiding them towards market leadership and growth.

Close Faster

23

Times more likely to acquire customers
Sign Up for Free

Improve Sales

4.5%

Of the total revenue because of data-driven innovations
Sign Up for Free

Retain More

6

Times more likely to retain customers
Sign Up for Free

Frequently Asked Questions

Find answers to commonly asked questions about our spatial analyst platform.

How frequently is the Riyadh Grid Aggregation dataset updated?

This dataset is updated annually to reflect the most recent changes and trends in energy consumption and production in Riyadh.

Does this dataset include renewable energy sources within the grid?

Yes, it includes data on various energy sources, including renewable energy contributions, providing a comprehensive view of the energy mix in Riyadh's grid.

Can this dataset assist in predicting future energy demands in Riyadh?

Absolutely. It's designed to aid in forecasting future energy demands by analyzing historical consumption and production patterns, essential for efficient energy planning and resource allocation.

Alex Sakal
Typically replies instantly
Alex Sakal
Hi there
How can i help you today?
Start Whatsapp Chat