Footfall data - Japan
This comprehensive dataset containing 277.322 rows captures footfall trends during breakfast, lunch, dinner, and nighttime hours, giving businesses a unique perspective into consumer behavior during these peak periods. Whether you're a restaurateur, retailer, or a market strategist, harness this data on xMap to identify prime locations, optimize operational hours, and target promotions effectively. With our location intelligence capabilities, visualize these mealtime patterns, analyze potential hotspots, and craft data-driven strategies to tap into the Japanese holiday market. Elevate your understanding of consumer preferences and behaviors during Japan's most celebrated times.


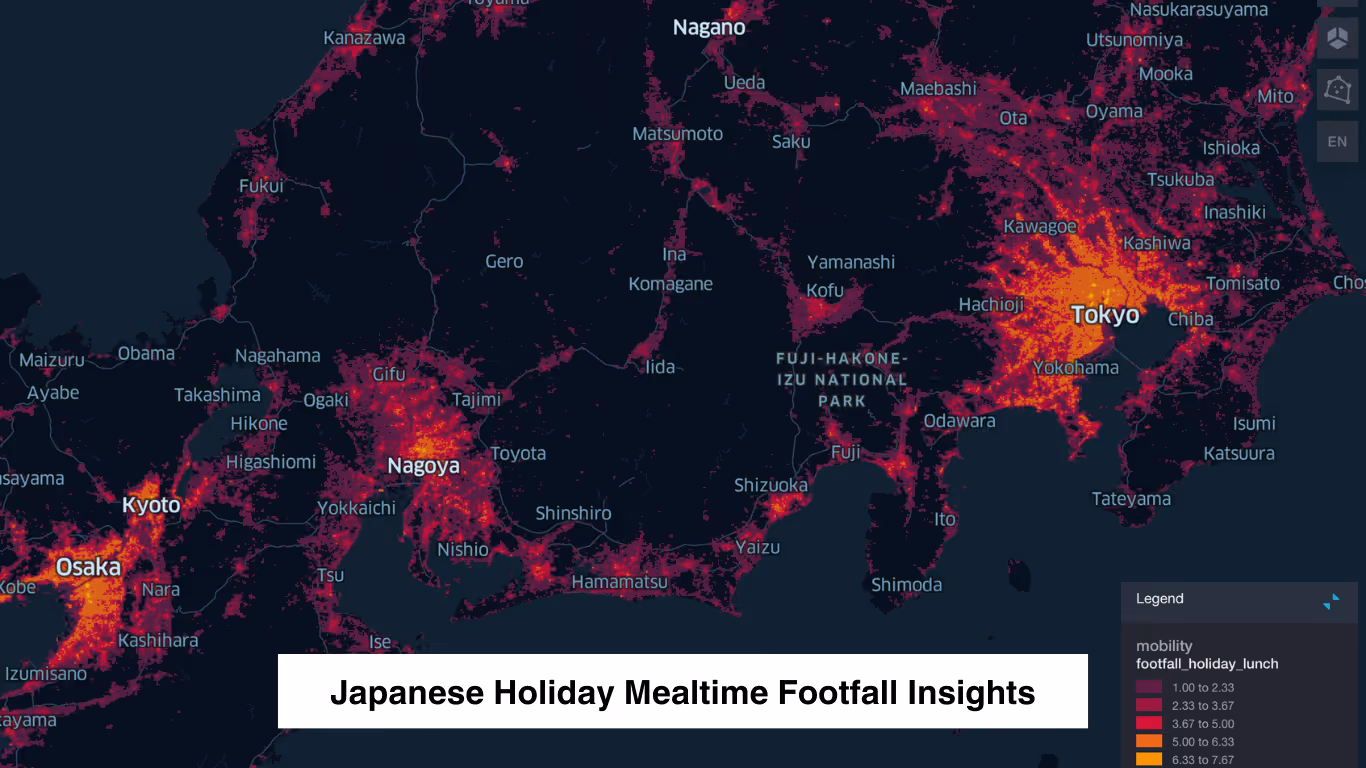
Insights on Japanese Holiday Meal Time Footfall
Dive into granular footfall trends during Japan's holiday mealtimes. This dataset captures pedestrian activity during breakfast, lunch, dinner, and nighttime on holidays, revealing unique consumer patterns. Leverage these insights to optimize business strategies, pinpoint prime operational hours, and connect with the Japanese market during their most cherished moments.
Download Japanese Holiday Mealtime Footfall Insights Data
Unlock the potential of the Japanese market with our Holiday Mealtime Footfall Insights. Gain a competitive edge by understanding when and where consumers are most active during holidays. Don't miss out on this valuable dataset – download now and transform your strategies with actionable intelligence!
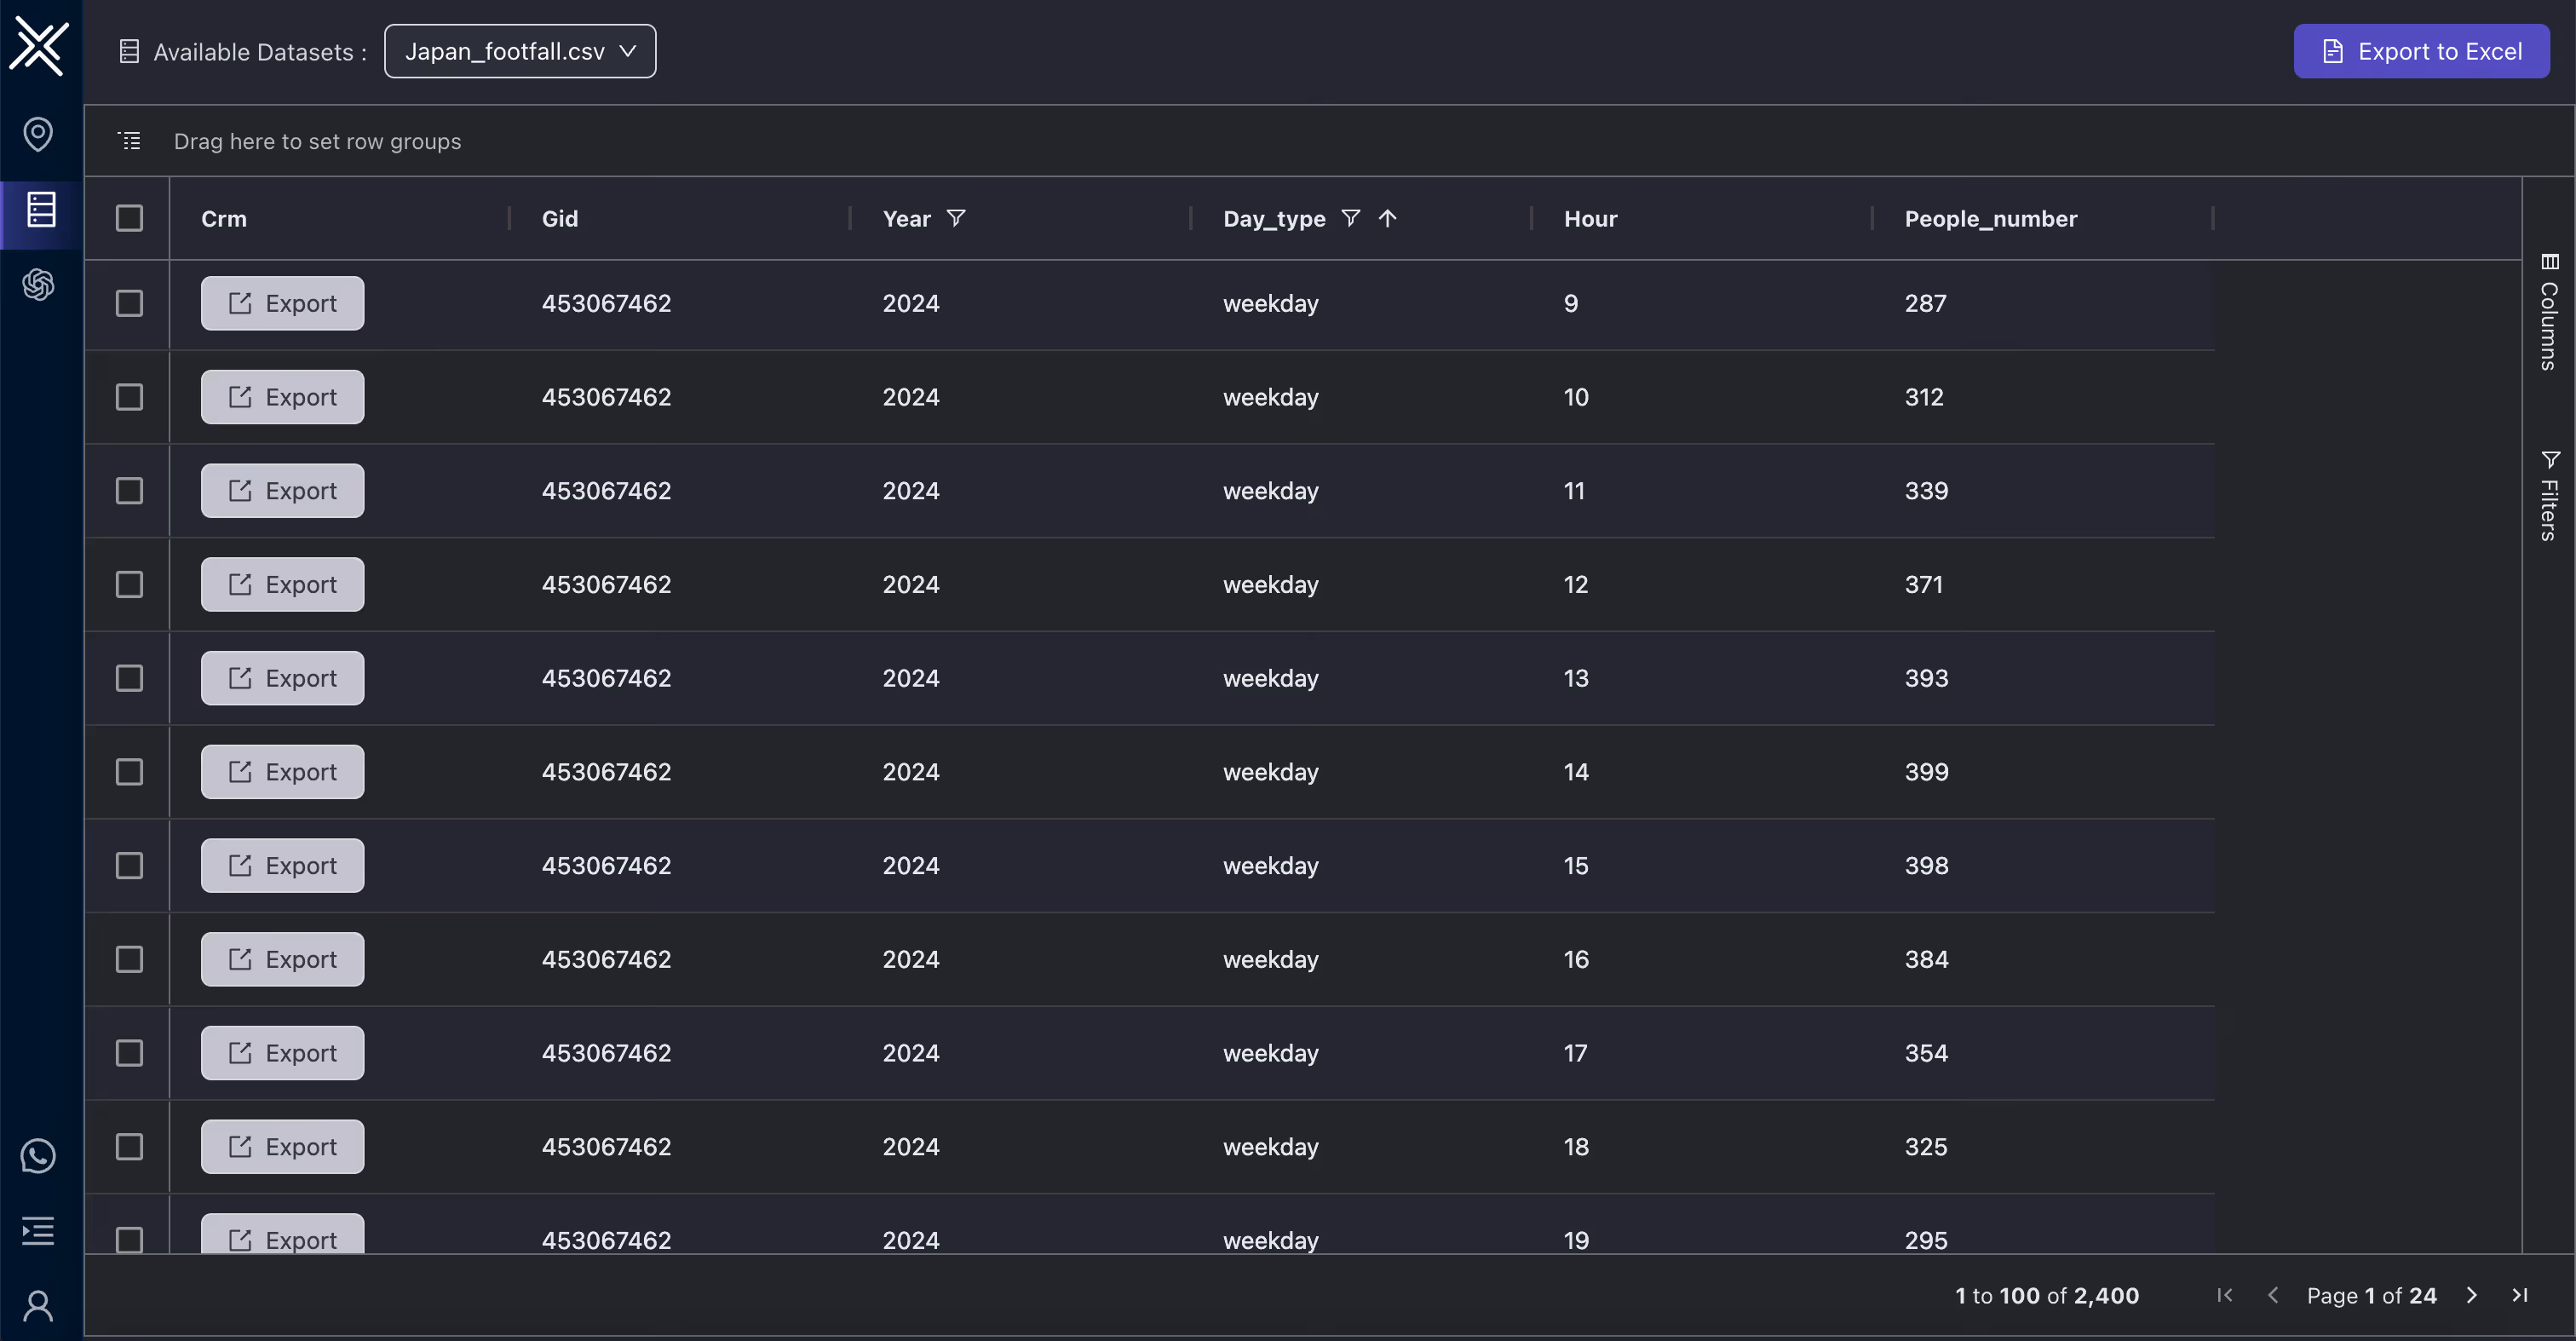
Key Variables
Dive into granular footfall trends during Japan's holiday mealtimes. This dataset captures pedestrian activity during breakfast, lunch, dinner, and nighttime on holidays, revealing unique consumer patterns. Leverage these insights to optimize business strategies, pinpoint prime operational hours, and connect with the Japanese market during their most cherished moments.
Use Cases
How can this dataset benefit you?
Restaurateurs can leverage the insights from this dataset to determine the most lucrative times and locations to operate during Japanese holidays. From adjusting opening hours to designing special holiday menus, businesses can make data-driven decisions to attract the highest footfall and maximize revenue.
Retailers can utilize the footfall data to time their promotions and sales effectively. By aligning special deals or launches with peak footfall times like lunch or dinner, they can drive more in-store traffic and capitalize on increased consumer presence during holidays.
City planners and local governments can use the dataset to better understand pedestrian movement during holidays. This can guide decisions related to public transportation scheduling, parking availability, and even the placement of public amenities like benches or restrooms in high footfall areas during key meal times.
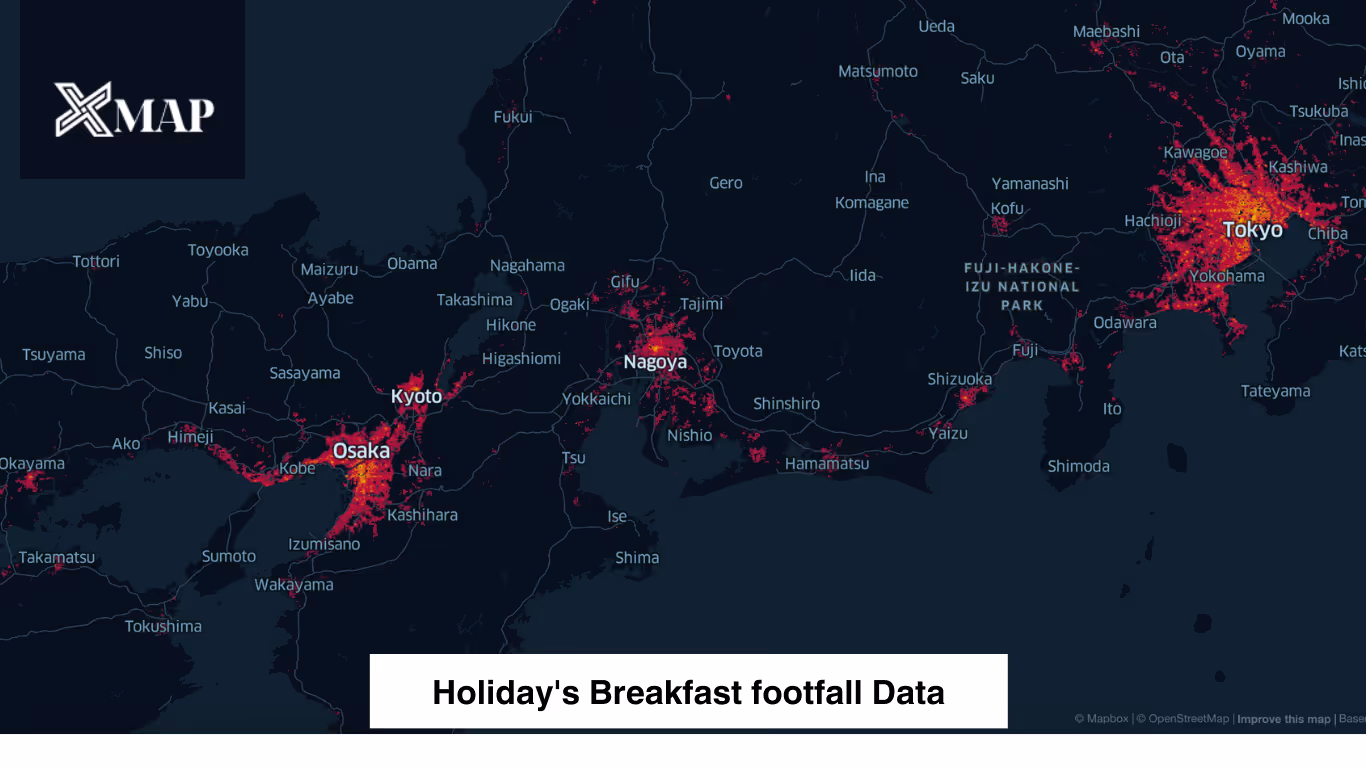
Holiday's Breakfast footfall Data:
Embark on a deep exploration of breakfast-time pedestrian activity with our dataset comprising 182,596 records. Unveil intricate patterns, peak hours, and areas of high footfall during the morning rush in Japan. This comprehensive collection is a must-have for businesses aiming to capitalize on early-bird consumer behaviors. Harness these insights to fine-tune operations, promotional efforts, and engagement strategies during the most important meal of the day.
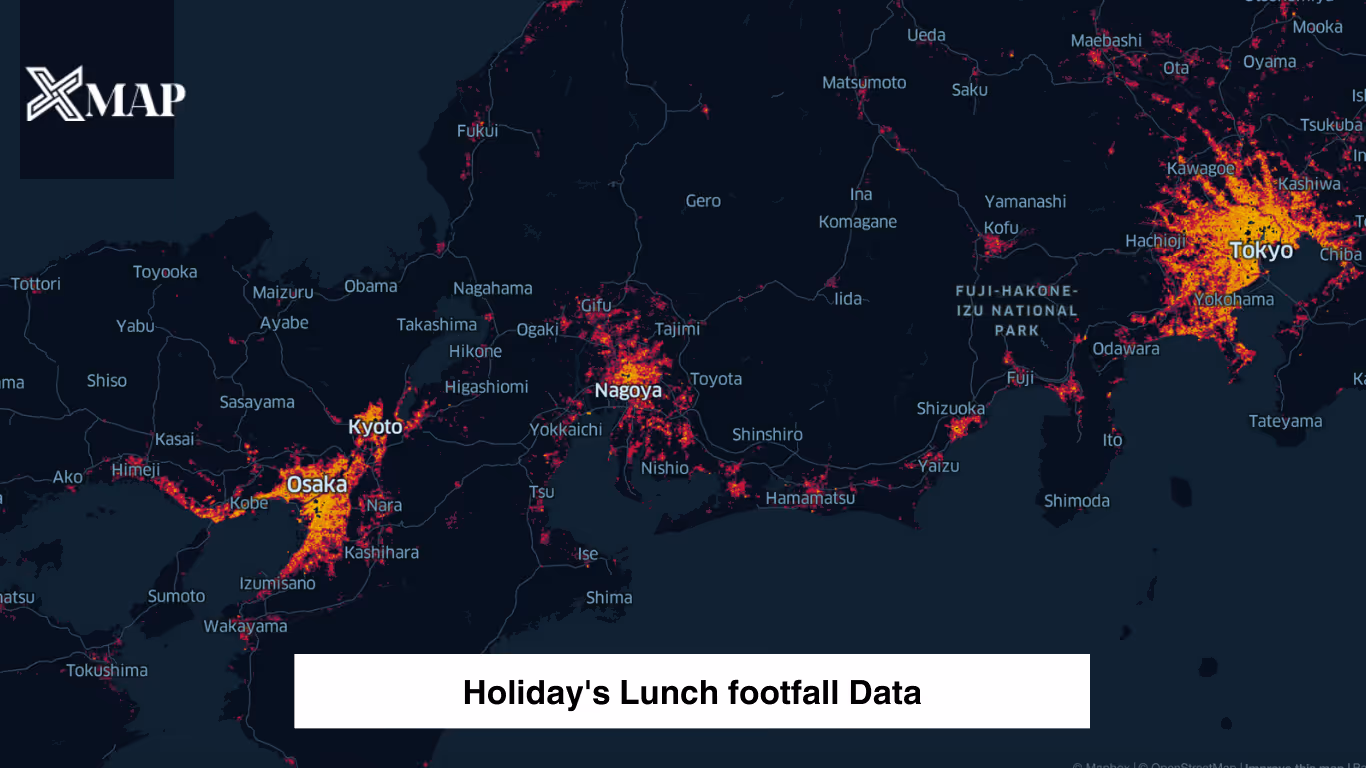
Holiday's Lunch footfall Data:
Dive into the bustling midday dynamics with our dataset, boasting 191,378 records on lunchtime footfall. Capture the essence of Japan's daytime pedestrian movement, identifying prime locations and peak activity hours. Essential for enterprises looking to tap into the midday consumer rush, this data empowers businesses to streamline operations, craft timely promotions, and engage effectively during the lunchtime buzz. Stay ahead by understanding the pulse of the noon-hour crowd.
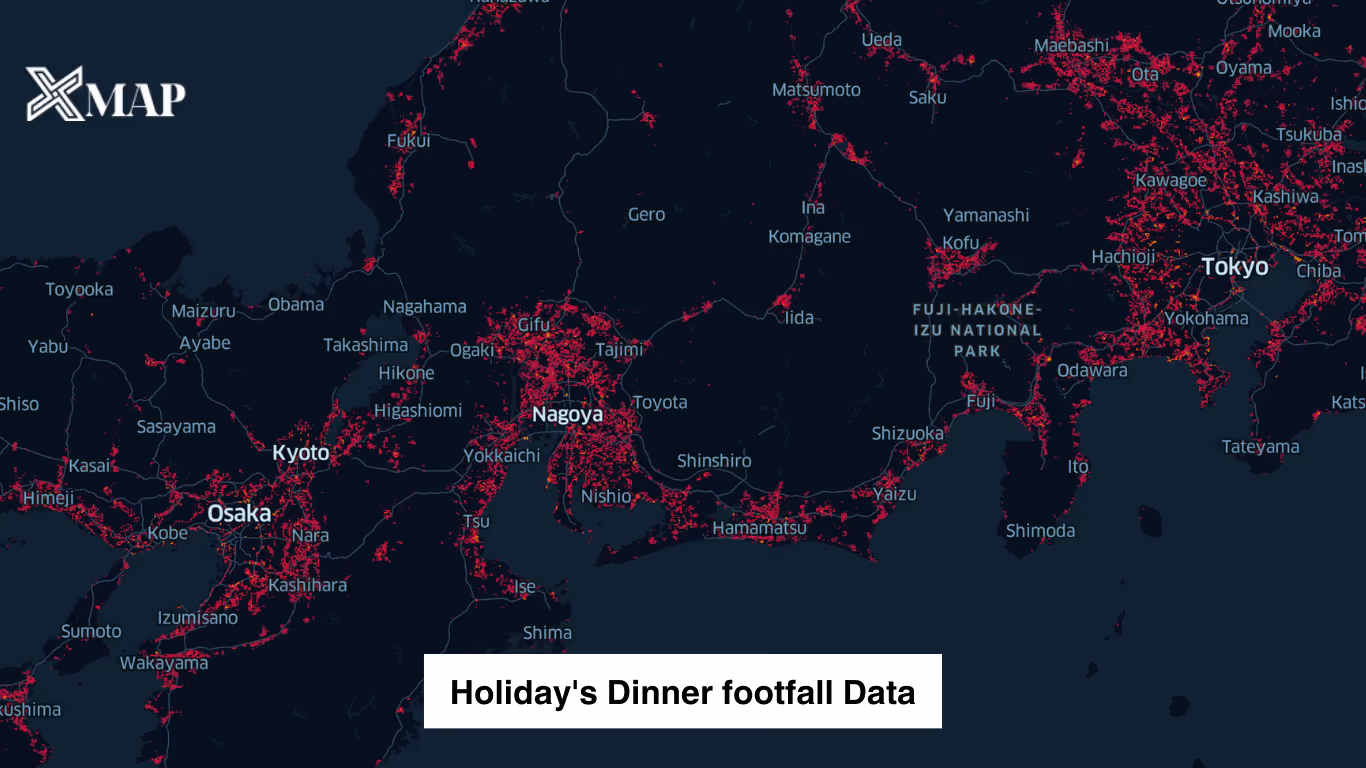
Holiday's Dinner footfall Data:
Step into the evening allure with our dataset encompassing 181,157 records of dinner-time footfall. Witness the nuances of Japan's nocturnal pedestrian flow, spotlighting popular locales and peak engagement windows. Indispensable for businesses aiming to resonate with the evening diner, this data aids in refining operations, orchestrating evening-centric campaigns, and connecting genuinely during the dinner hours. Illuminate your strategies with the twilight rhythms of the dining crowd.
Interactive Visualization of Tokyo's People Flow
This dynamic GIF offers an interactive visualization of people's movements across Tokyo. Users can click on specific points to reveal detailed insights, such as peak traffic times and flow patterns, enhancing understanding of urban dynamics.

Visual Analysis of Foot Traffic in Tokyo
This brief video provides a visual representation of foot traffic across various districts in Tokyo. By displaying data on a grid, viewers can easily compare activity levels, aiding urban planners and businesses in decision-making processes.
Types of people flow data
Now that we've explored the wide array of applications for people flow data, let's delve deeper into the different types of this data that can be collected and analyzed. Understanding these types is vital as it will help you choose the most suitable data analyzation method for your specific business needs and ensure you fully leverage the potential of people flow data.
1. Grid-Based Count Data
Grid-based count data refers to the collection of people flow information within a predefined grid layout. Each cell in the grid represents a specific area, and the data tracks the number of individuals moving through or present in each cell over time. This type of data is useful for analyzing spatial distribution and density of pedestrian traffic, identifying hotspots, and planning for resource allocation or infrastructure development.

2. Origin-Destination Data
Origin-destination (OD) data tracks the movement of individuals from a starting point (origin) to an endpoint (destination). This data provides insights into travel patterns, commuting trends, and the flow of people between different areas. It is essential for transportation planning, route optimization, and understanding the demand for public transit or other mobility services.

3. Map Matching Road Link Count Data
Map matching road link count data involves matching GPS traces or movement data to specific road segments or links on a map. This data provides information on the volume of traffic on different road segments, allowing for the analysis of traffic flow, congestion patterns, and the identification of critical transportation corridors. It is crucial for traffic management, road network planning, and the development of intelligent transportation systems.

What is the return on investment for using people flow data?
The Return on Investment (ROI) of using people flow data can be significant, as it helps organizations and municipalities make informed decisions that lead to improved efficiency, enhanced safety, and increased revenue. Some of the key benefits that contribute to a positive ROI include:
Improved Urban Planning
By understanding pedestrian traffic patterns, cities can optimize infrastructure investments, reduce congestion, and enhance the quality of urban life.

Enhanced Retail Performance
Retailers can use people flow data to optimize store layouts, adjust staffing levels, and tailor marketing strategies, leading to increased sales and customer satisfaction.

Efficient Transportation Management
Transit authorities can use the data to optimize routes, schedules, and capacity, reducing operational costs and improving service quality.
Effective Event Management
Organizers can use people flow data to design event layouts, manage crowd control, and ensure safety, leading to a better attendee experience and potentially higher revenue.
Optimized Public Spaces
Municipalities can use the data to design parks, plazas, and public spaces that are safe, accessible, and enjoyable, attracting more visitors and boosting local economies.
Cost Savings
By making data-driven decisions, organizations can reduce unnecessary expenditures, allocate resources more efficiently, and achieve cost savings in various areas such as staffing, maintenance, and security.
Why xMap?
xMap empowers businesses with unparalleled location intelligence and comprehensive data analysis, guiding them towards market leadership and growth.
Frequently Asked Questions
Find answers to commonly asked questions about our spatial analyst platform.
The dataset covers footfall trends during breakfast, lunch, dinner, and nighttime hours specifically on Japanese holidays.
The data is collected through a combination of location intelligence tools and monitoring systems, ensuring high accuracy. It is periodically updated to reflect the latest trends and changes in consumer behavior.
Absolutely! The dataset is designed to be compatible with other datasets on xMap, allowing users to combine and analyze data for richer insights and more informed decision-making.

