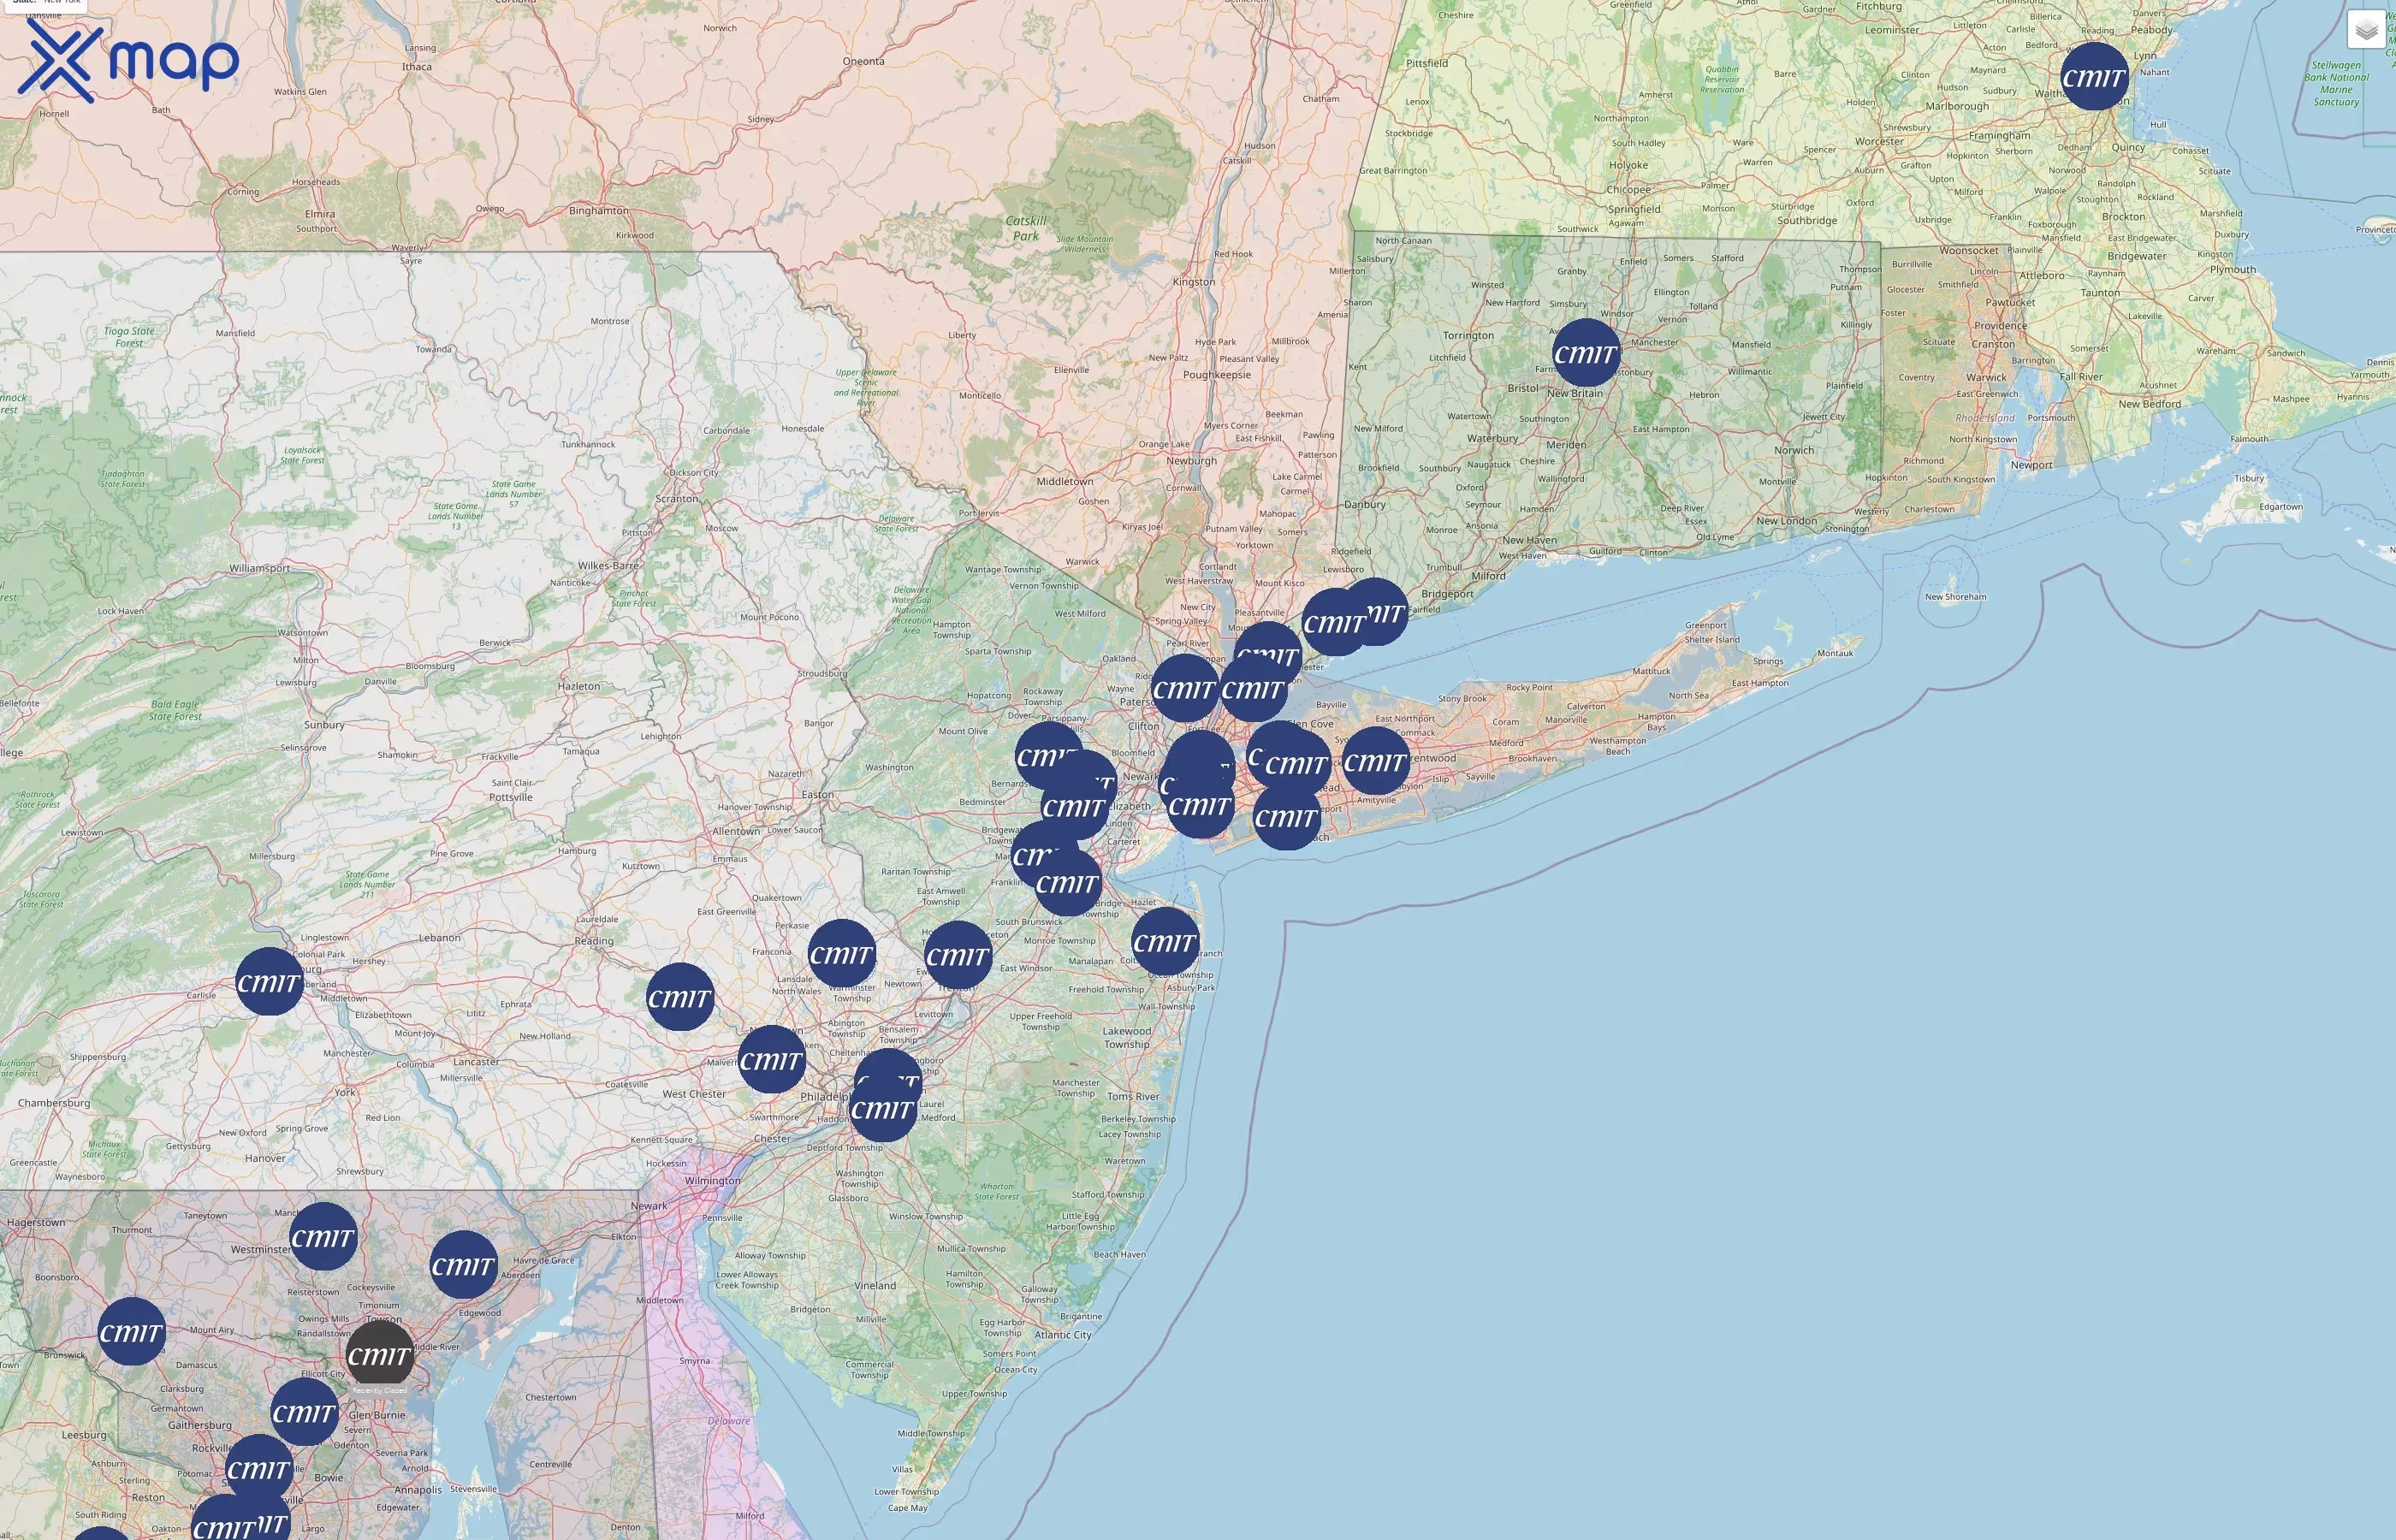
Number of CMIT Solutions Locations in the United States of America
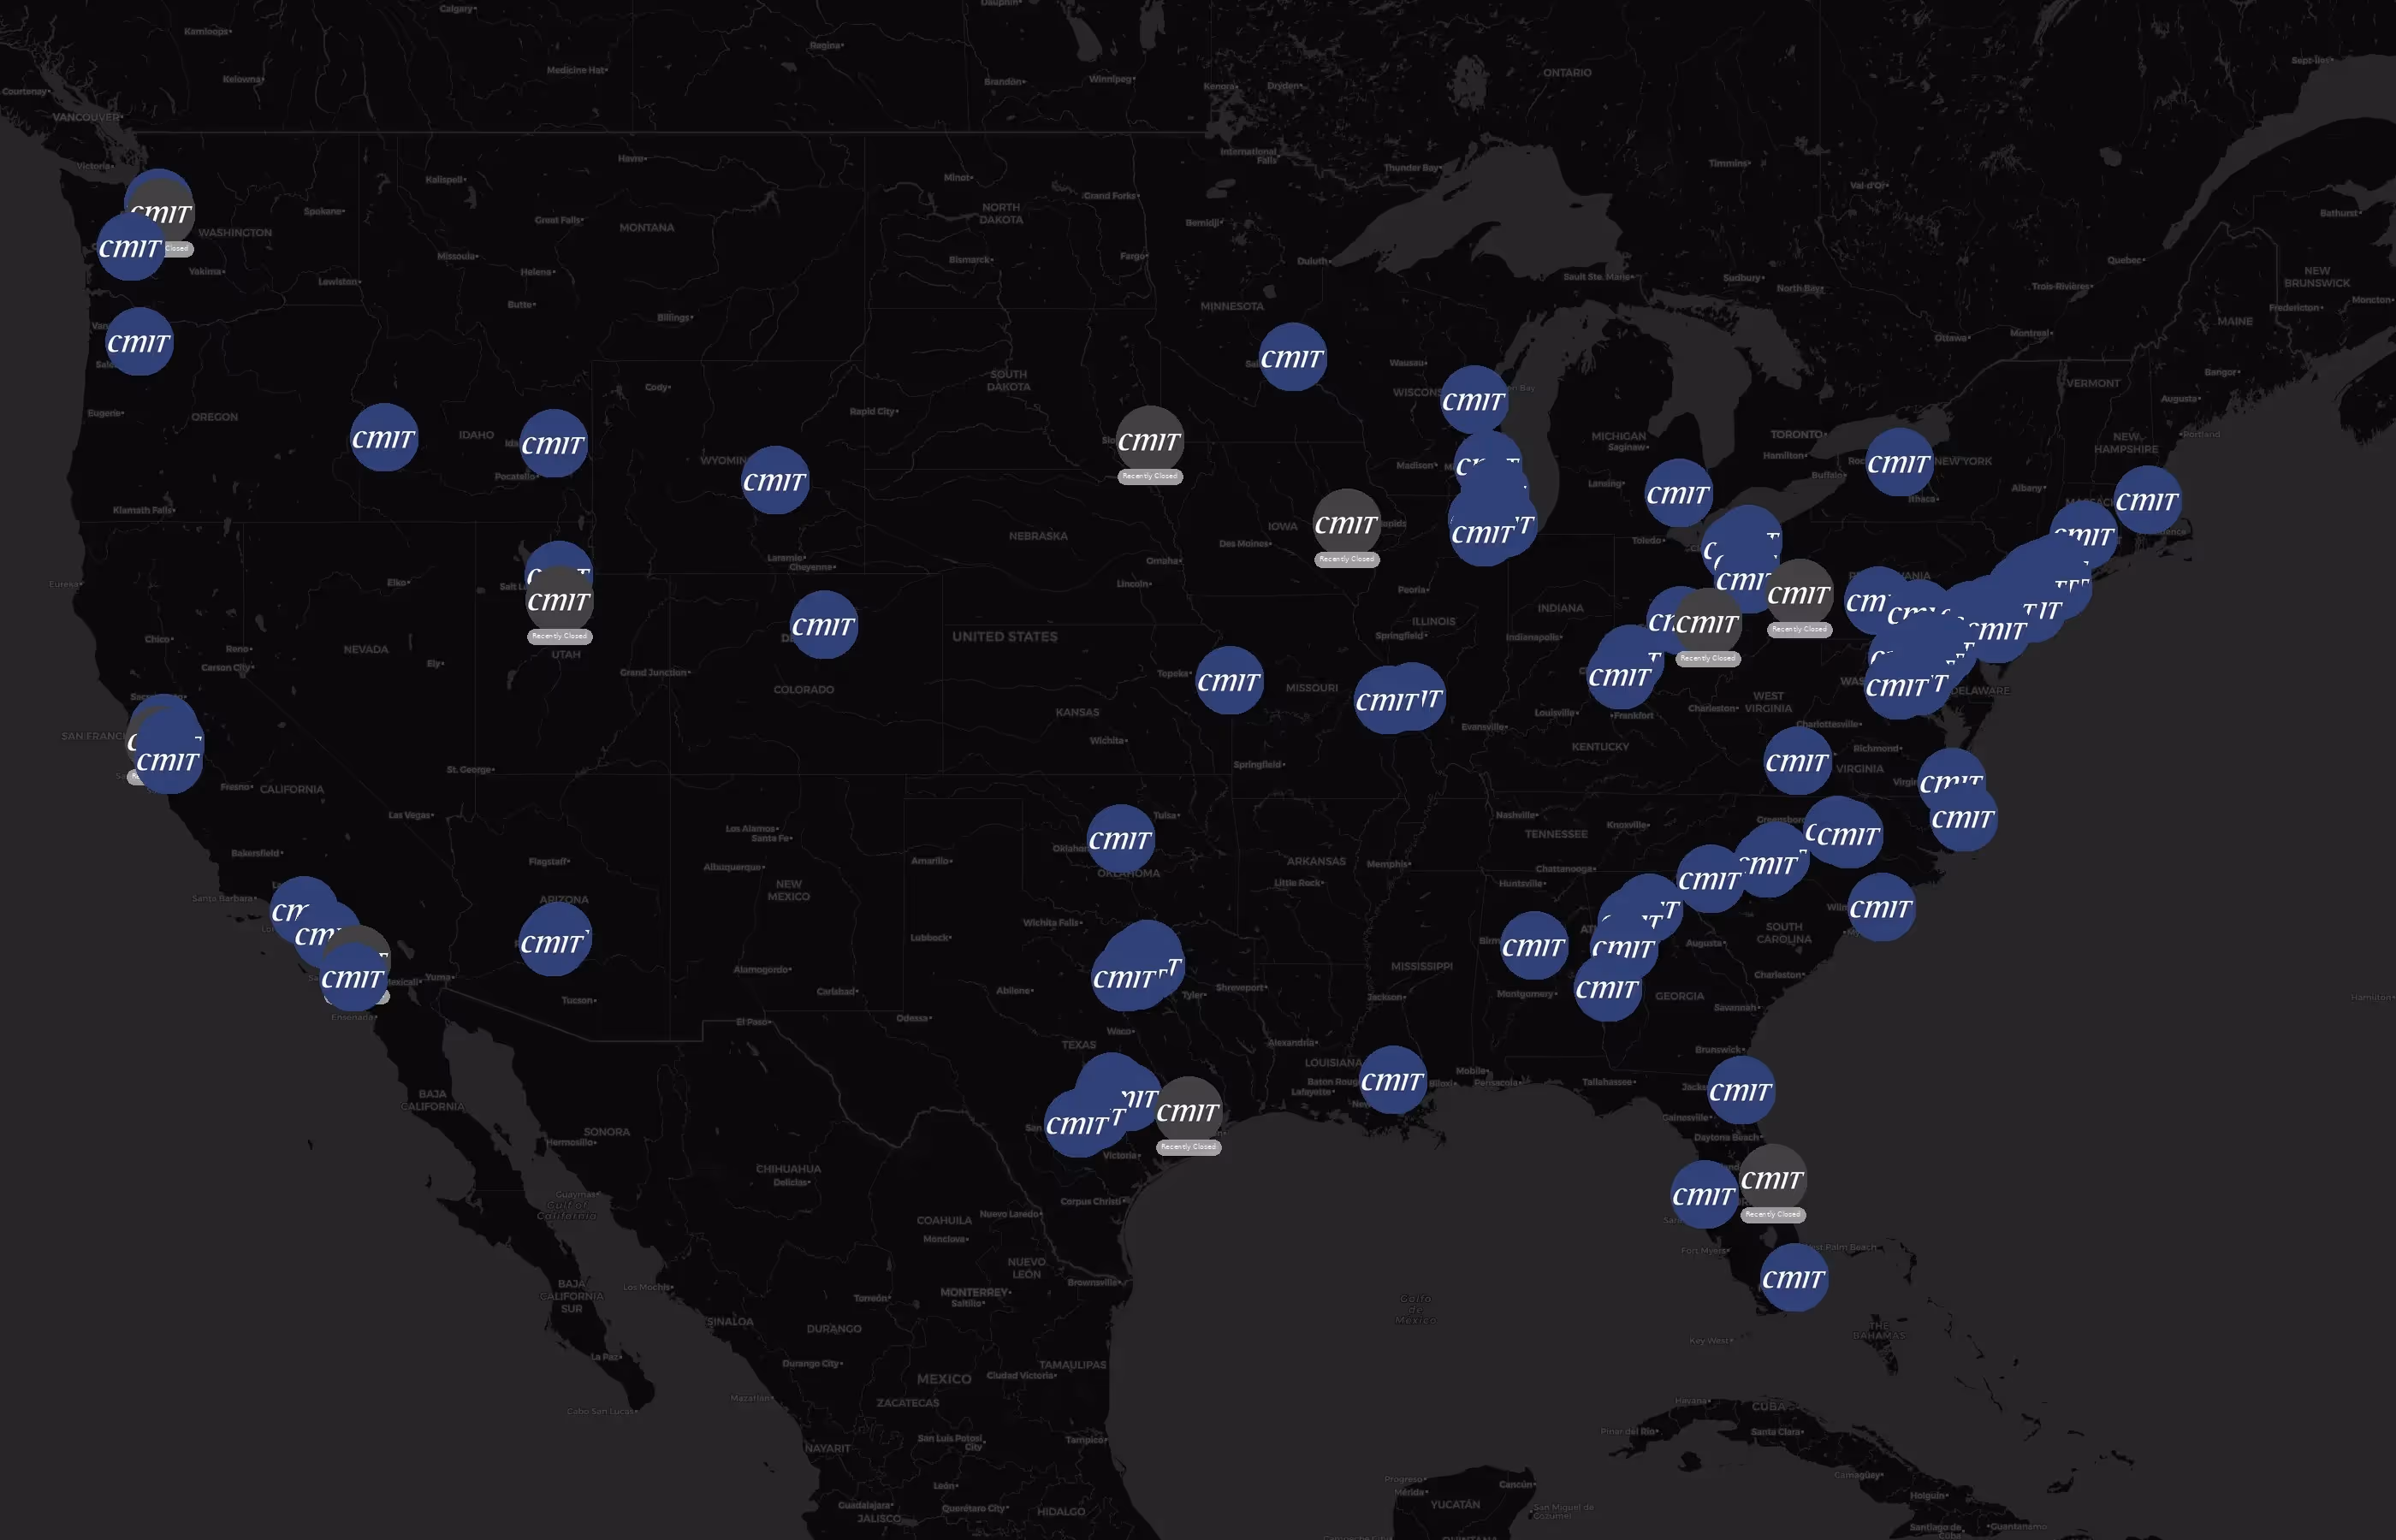
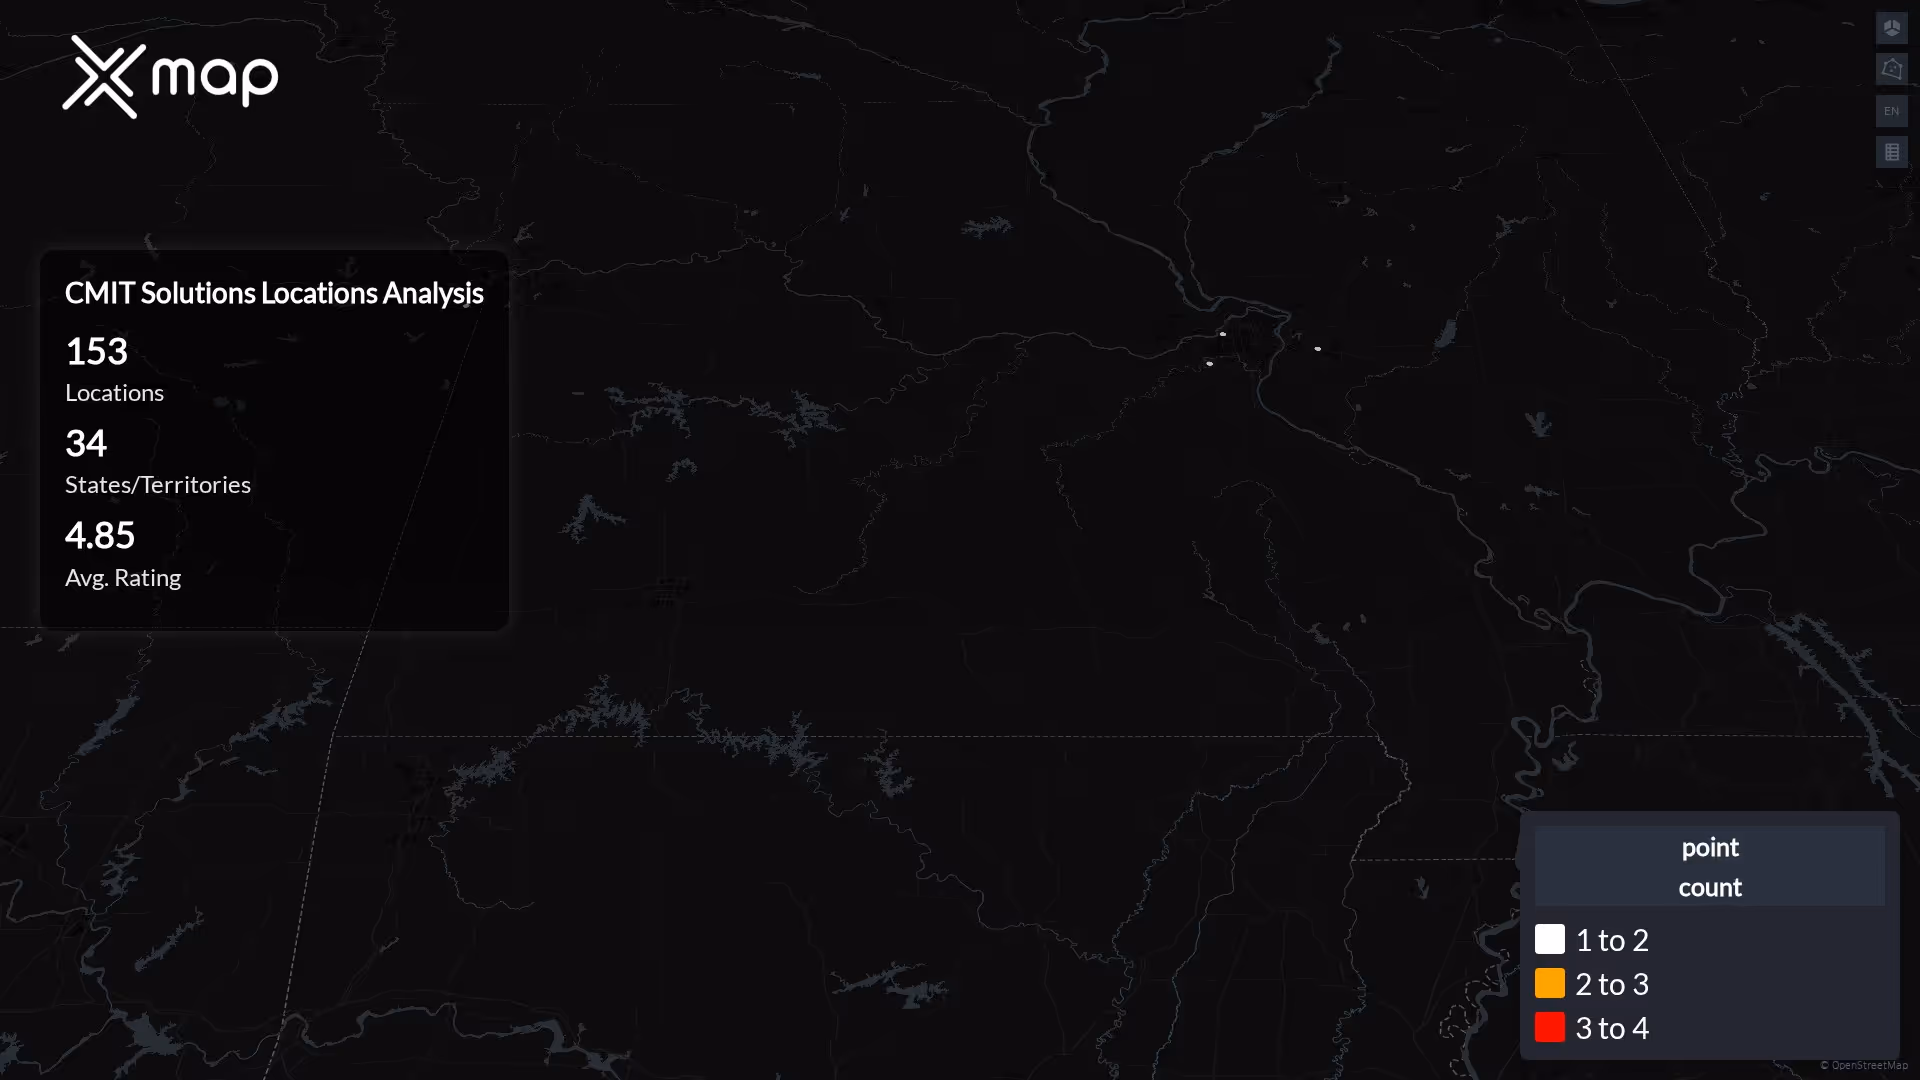
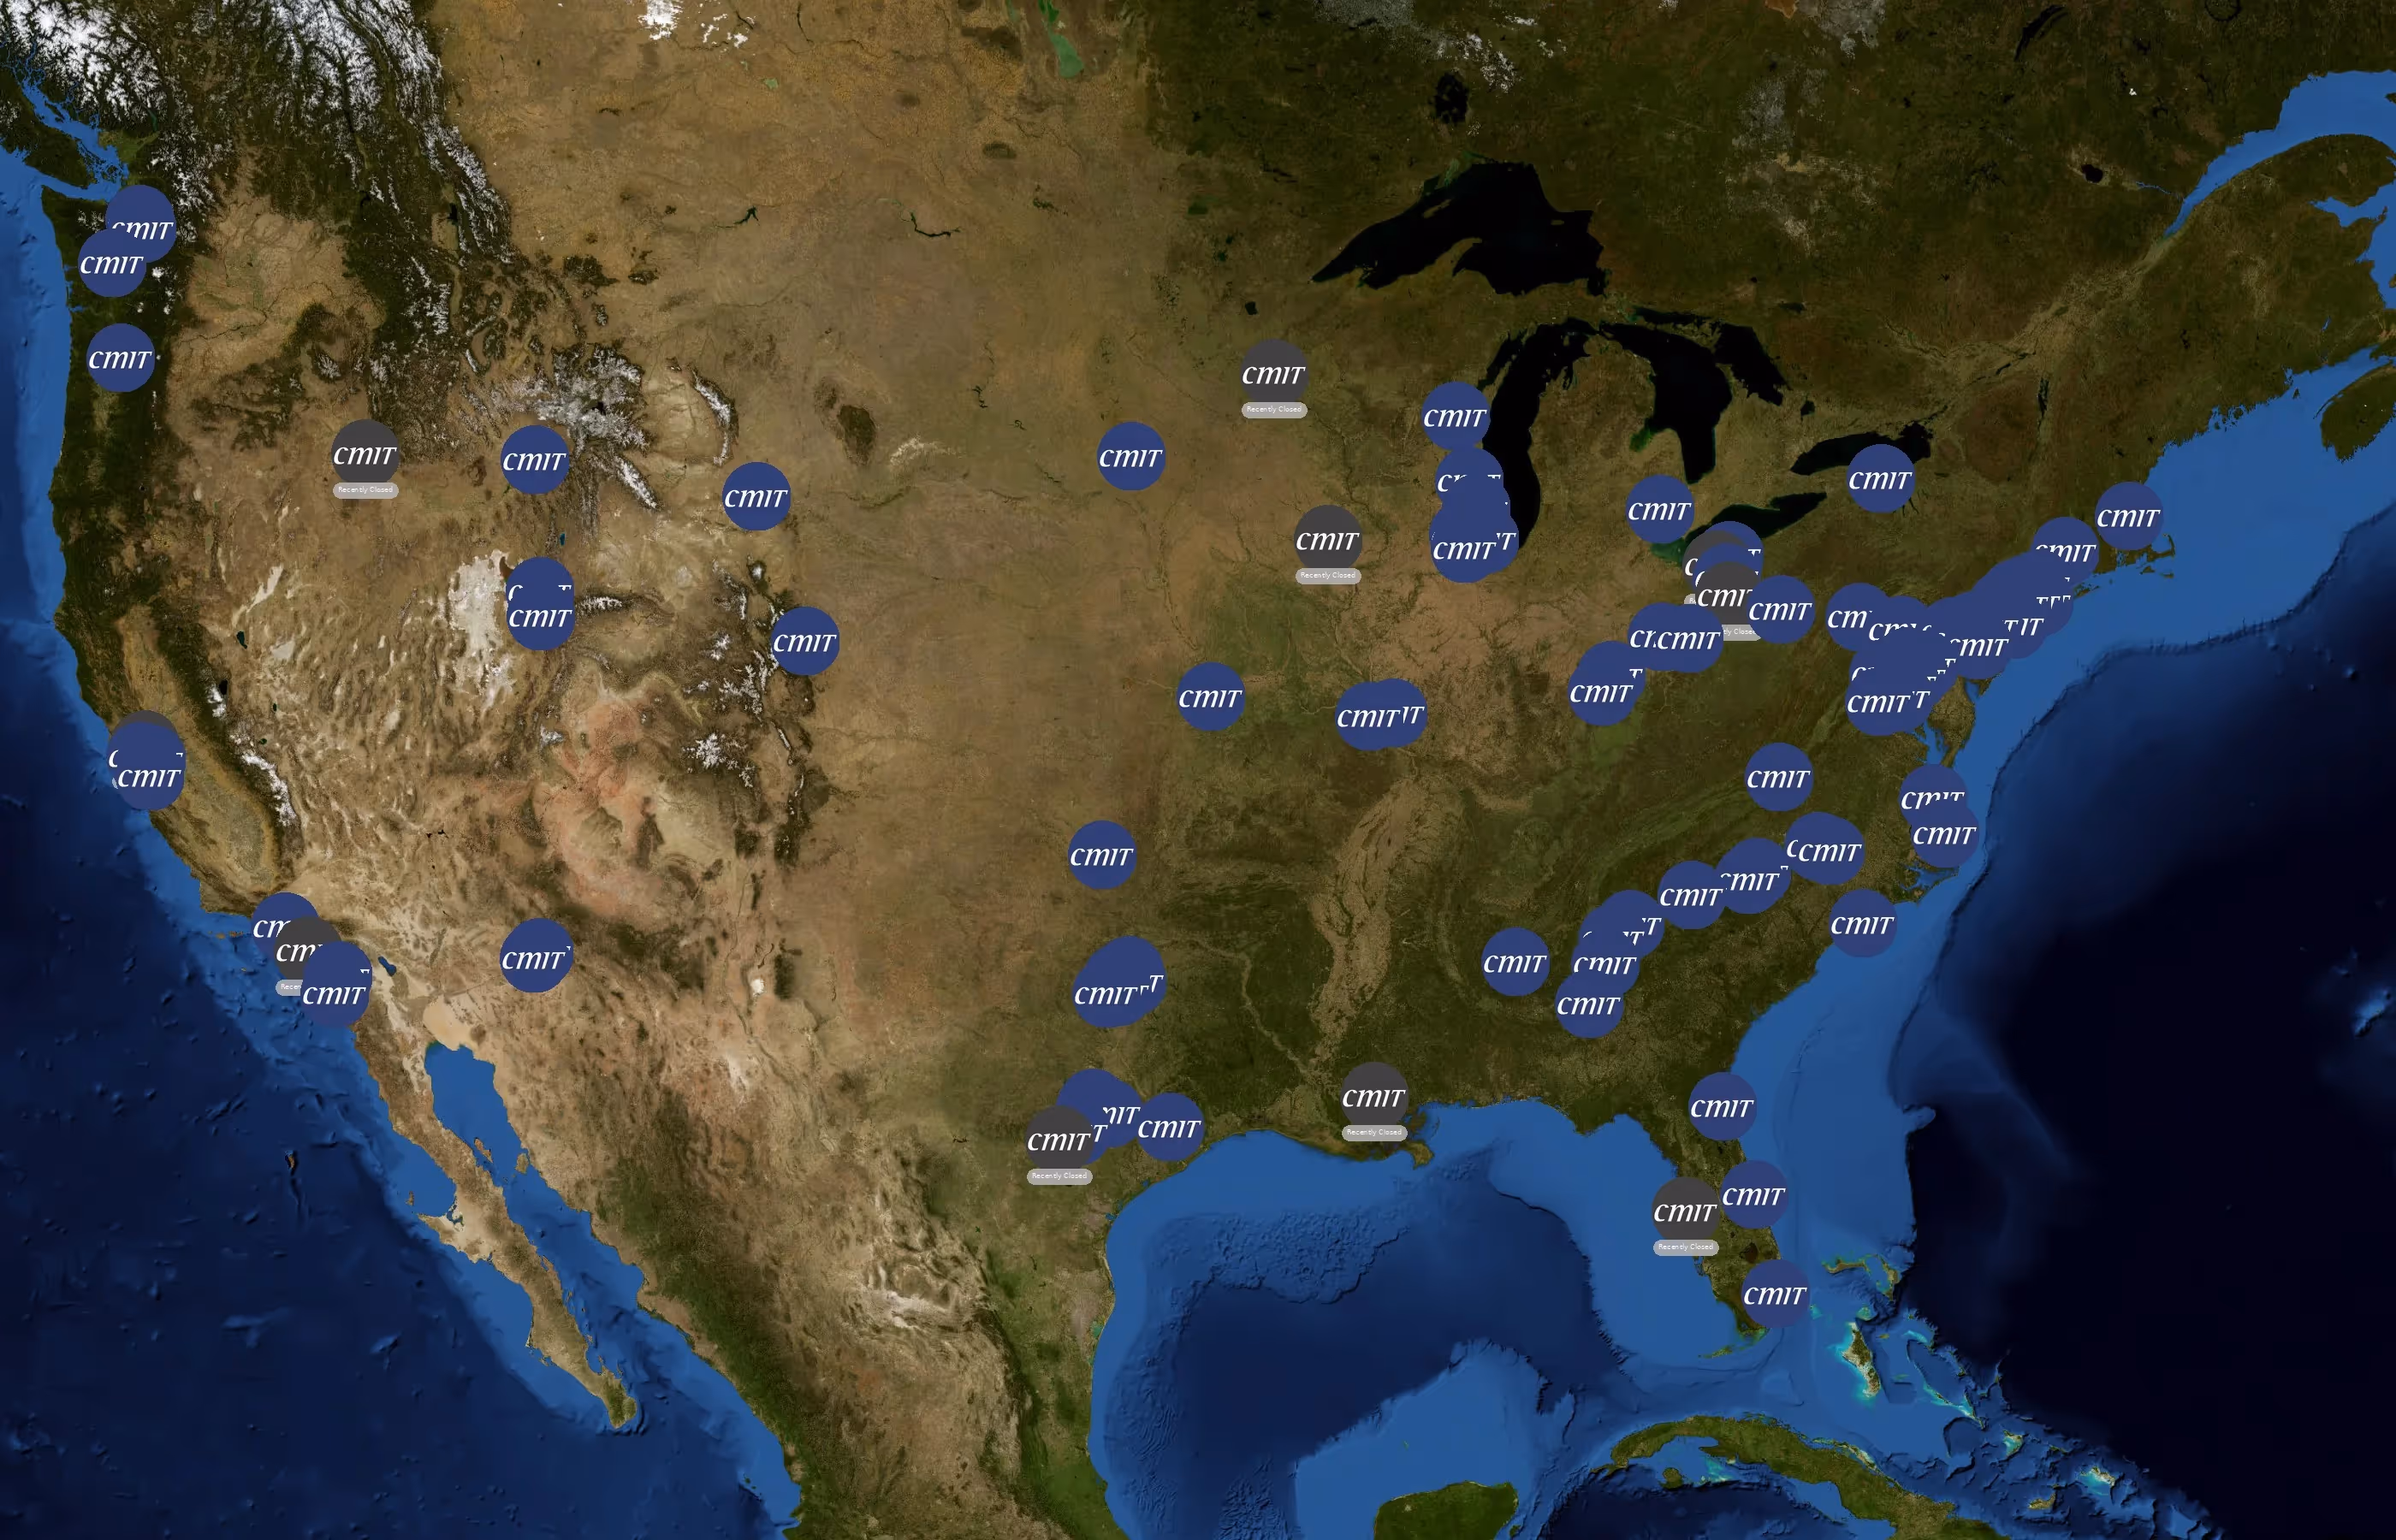
There are 153 CMIT Solutions locations in the United States of America as of February 16, 2026. The state or territory with the most CMIT Solutions locations is Texas, with 21 sites, accounting for roughly 13.7% of the total.
How many CMIT Solutions are there in the United States of America?

153

118

153

153

4
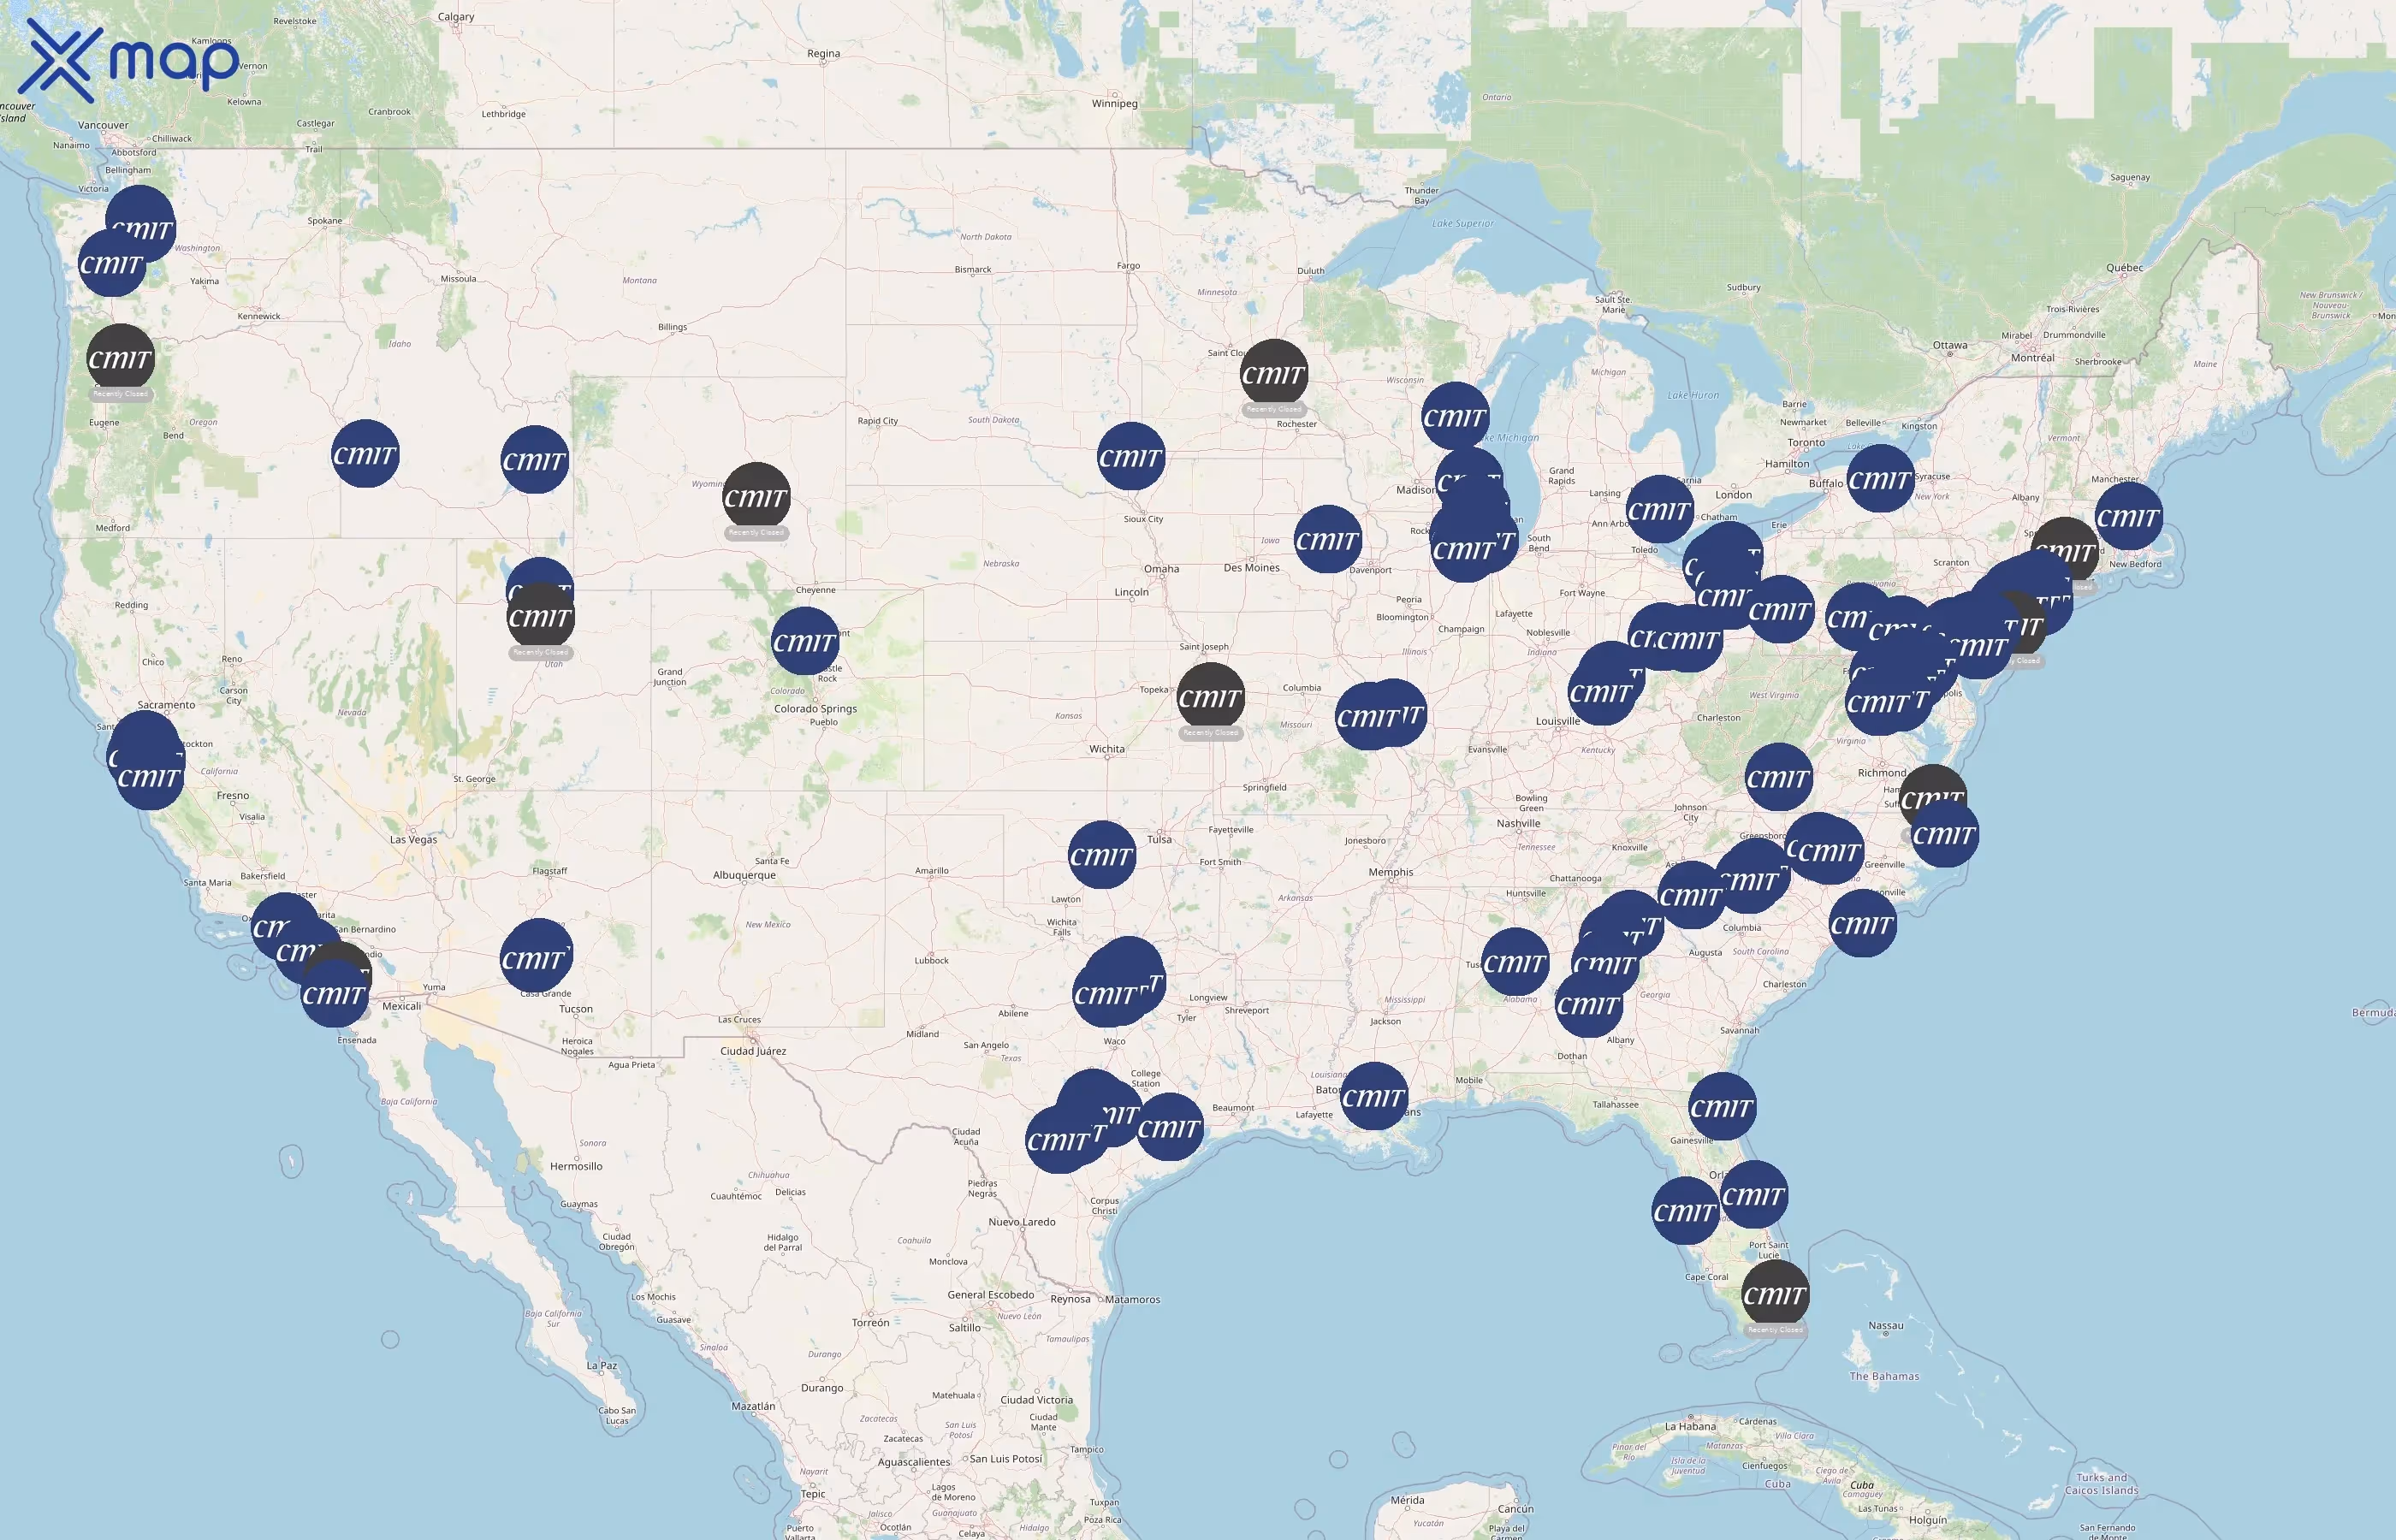
Distribution of CMIT Solutions Locations Across United States of America by State
CMIT Solutions operates 153 United States of America locations across 34 states. Largest clusters are in Texas, California, and NewYork; the top 10 states contain 68.0% of sites. Coverage is thinner in SouthCarolina, SouthDakota, and Wyoming.
Top 10 States with the most number of CMIT Solutions locations in United States of America
CMIT Solutions shows strong visitor engagement: 7 locations are above the mean traffic score (mean: 43.21) and 4 qualify as highly visited.
CMIT Solutions has 153 locations across the United States, with Texas leading at 21 locations (13.7%), followed by California and New York, each with 13 locations (8.5%). The top three states account for 30.7% of all locations, while the top ten states represent 68.0%. Wyoming offers the best access with one location per 577,929 people, whereas Michigan is the most stretched, with over 10 million people per location.
CMIT Solutions per capita insights
- States (Wyoming, Idaho, Arizona) enjoy the best per capita access to CMIT Solutions.
- States like California, Illinois, Pennsylvania, despite their large number of locations, are under-served on a per-person basis, signaling potential demand for suburban expansion.
- Several states strike a balance between population growth and CMIT Solutions density, making them hotspots for sustained competition.
Cities With the Most CMIT Solutions Locations in the United States of America
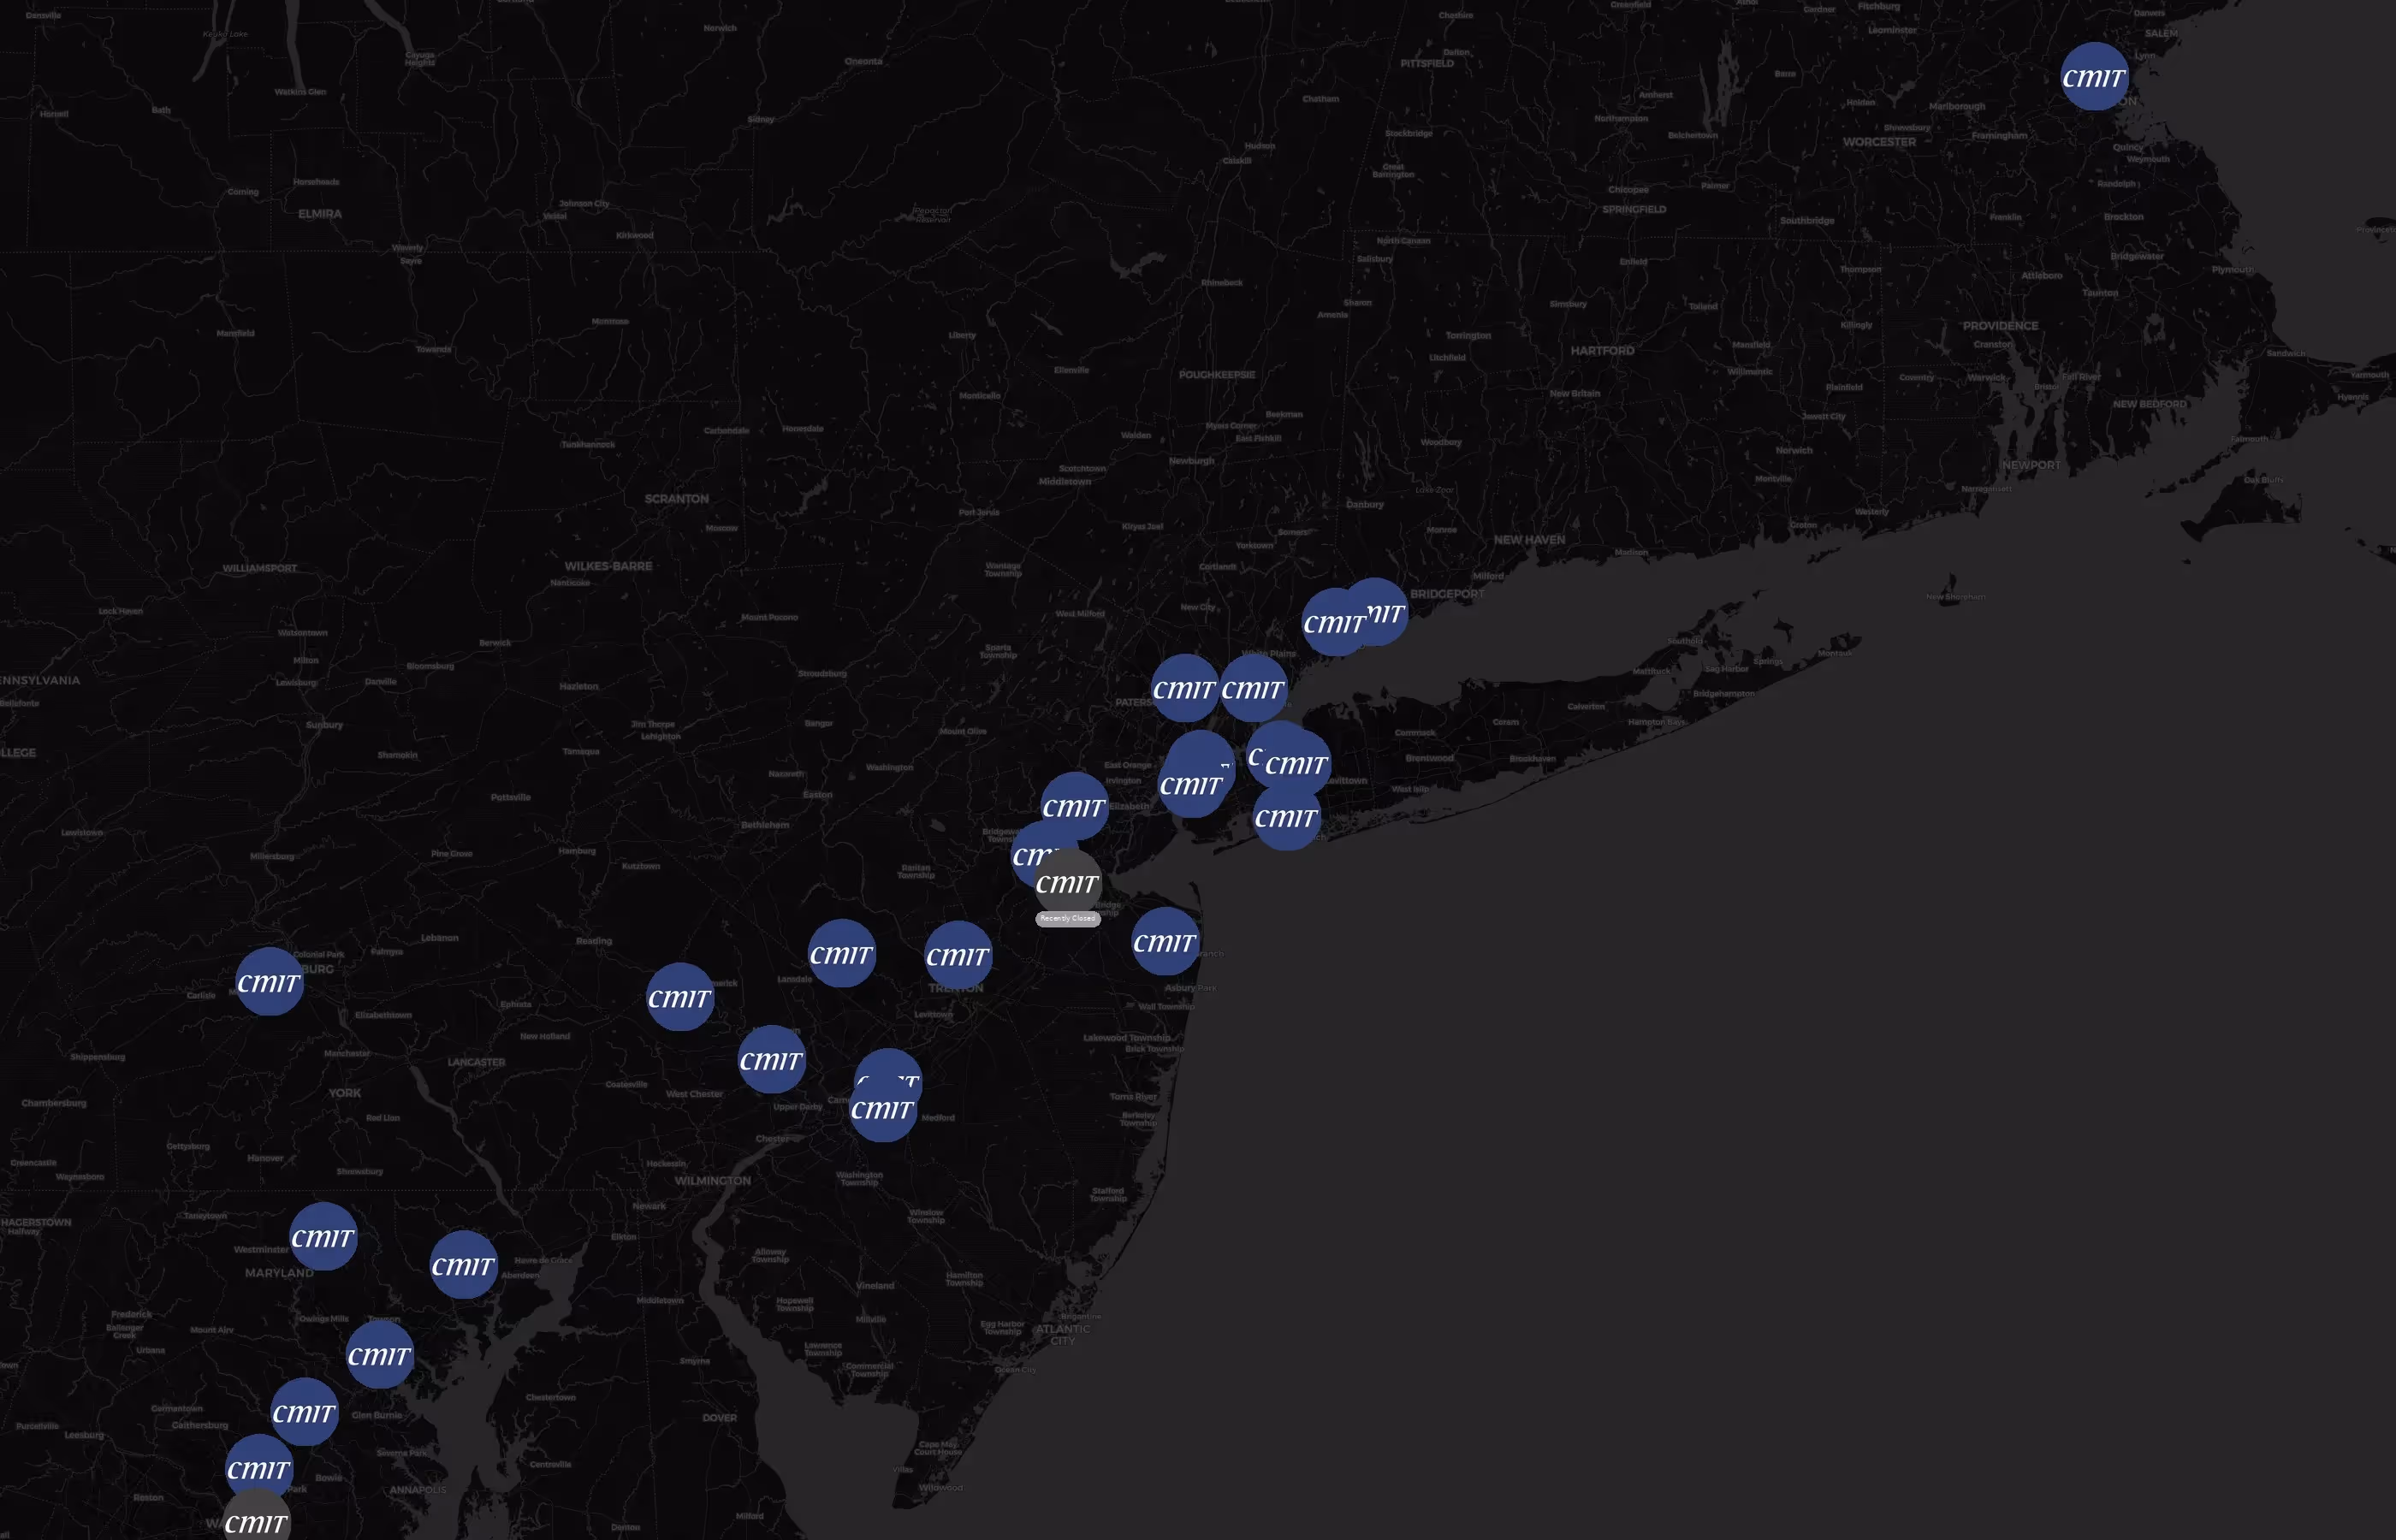
Locations concentrate around major metros such as Maricopa, Alameda, NewYork, Travis, and Collin. The top 10 cities account for 25.5% of U.S. sites.
Top 10 Cities Ranked by Location Count
CMIT Solutions operates 153 locations across the United States, with the top 10 cities accounting for 25.5% of all locations. Maricopa, Arizona leads with 7 locations, followed by Alameda, California, and New York, New York, each with 5 locations. Several Texas cities, including Travis and Collin, also have notable counts of 4 locations each. Other cities in the top 10 range from 2 to 3 locations.
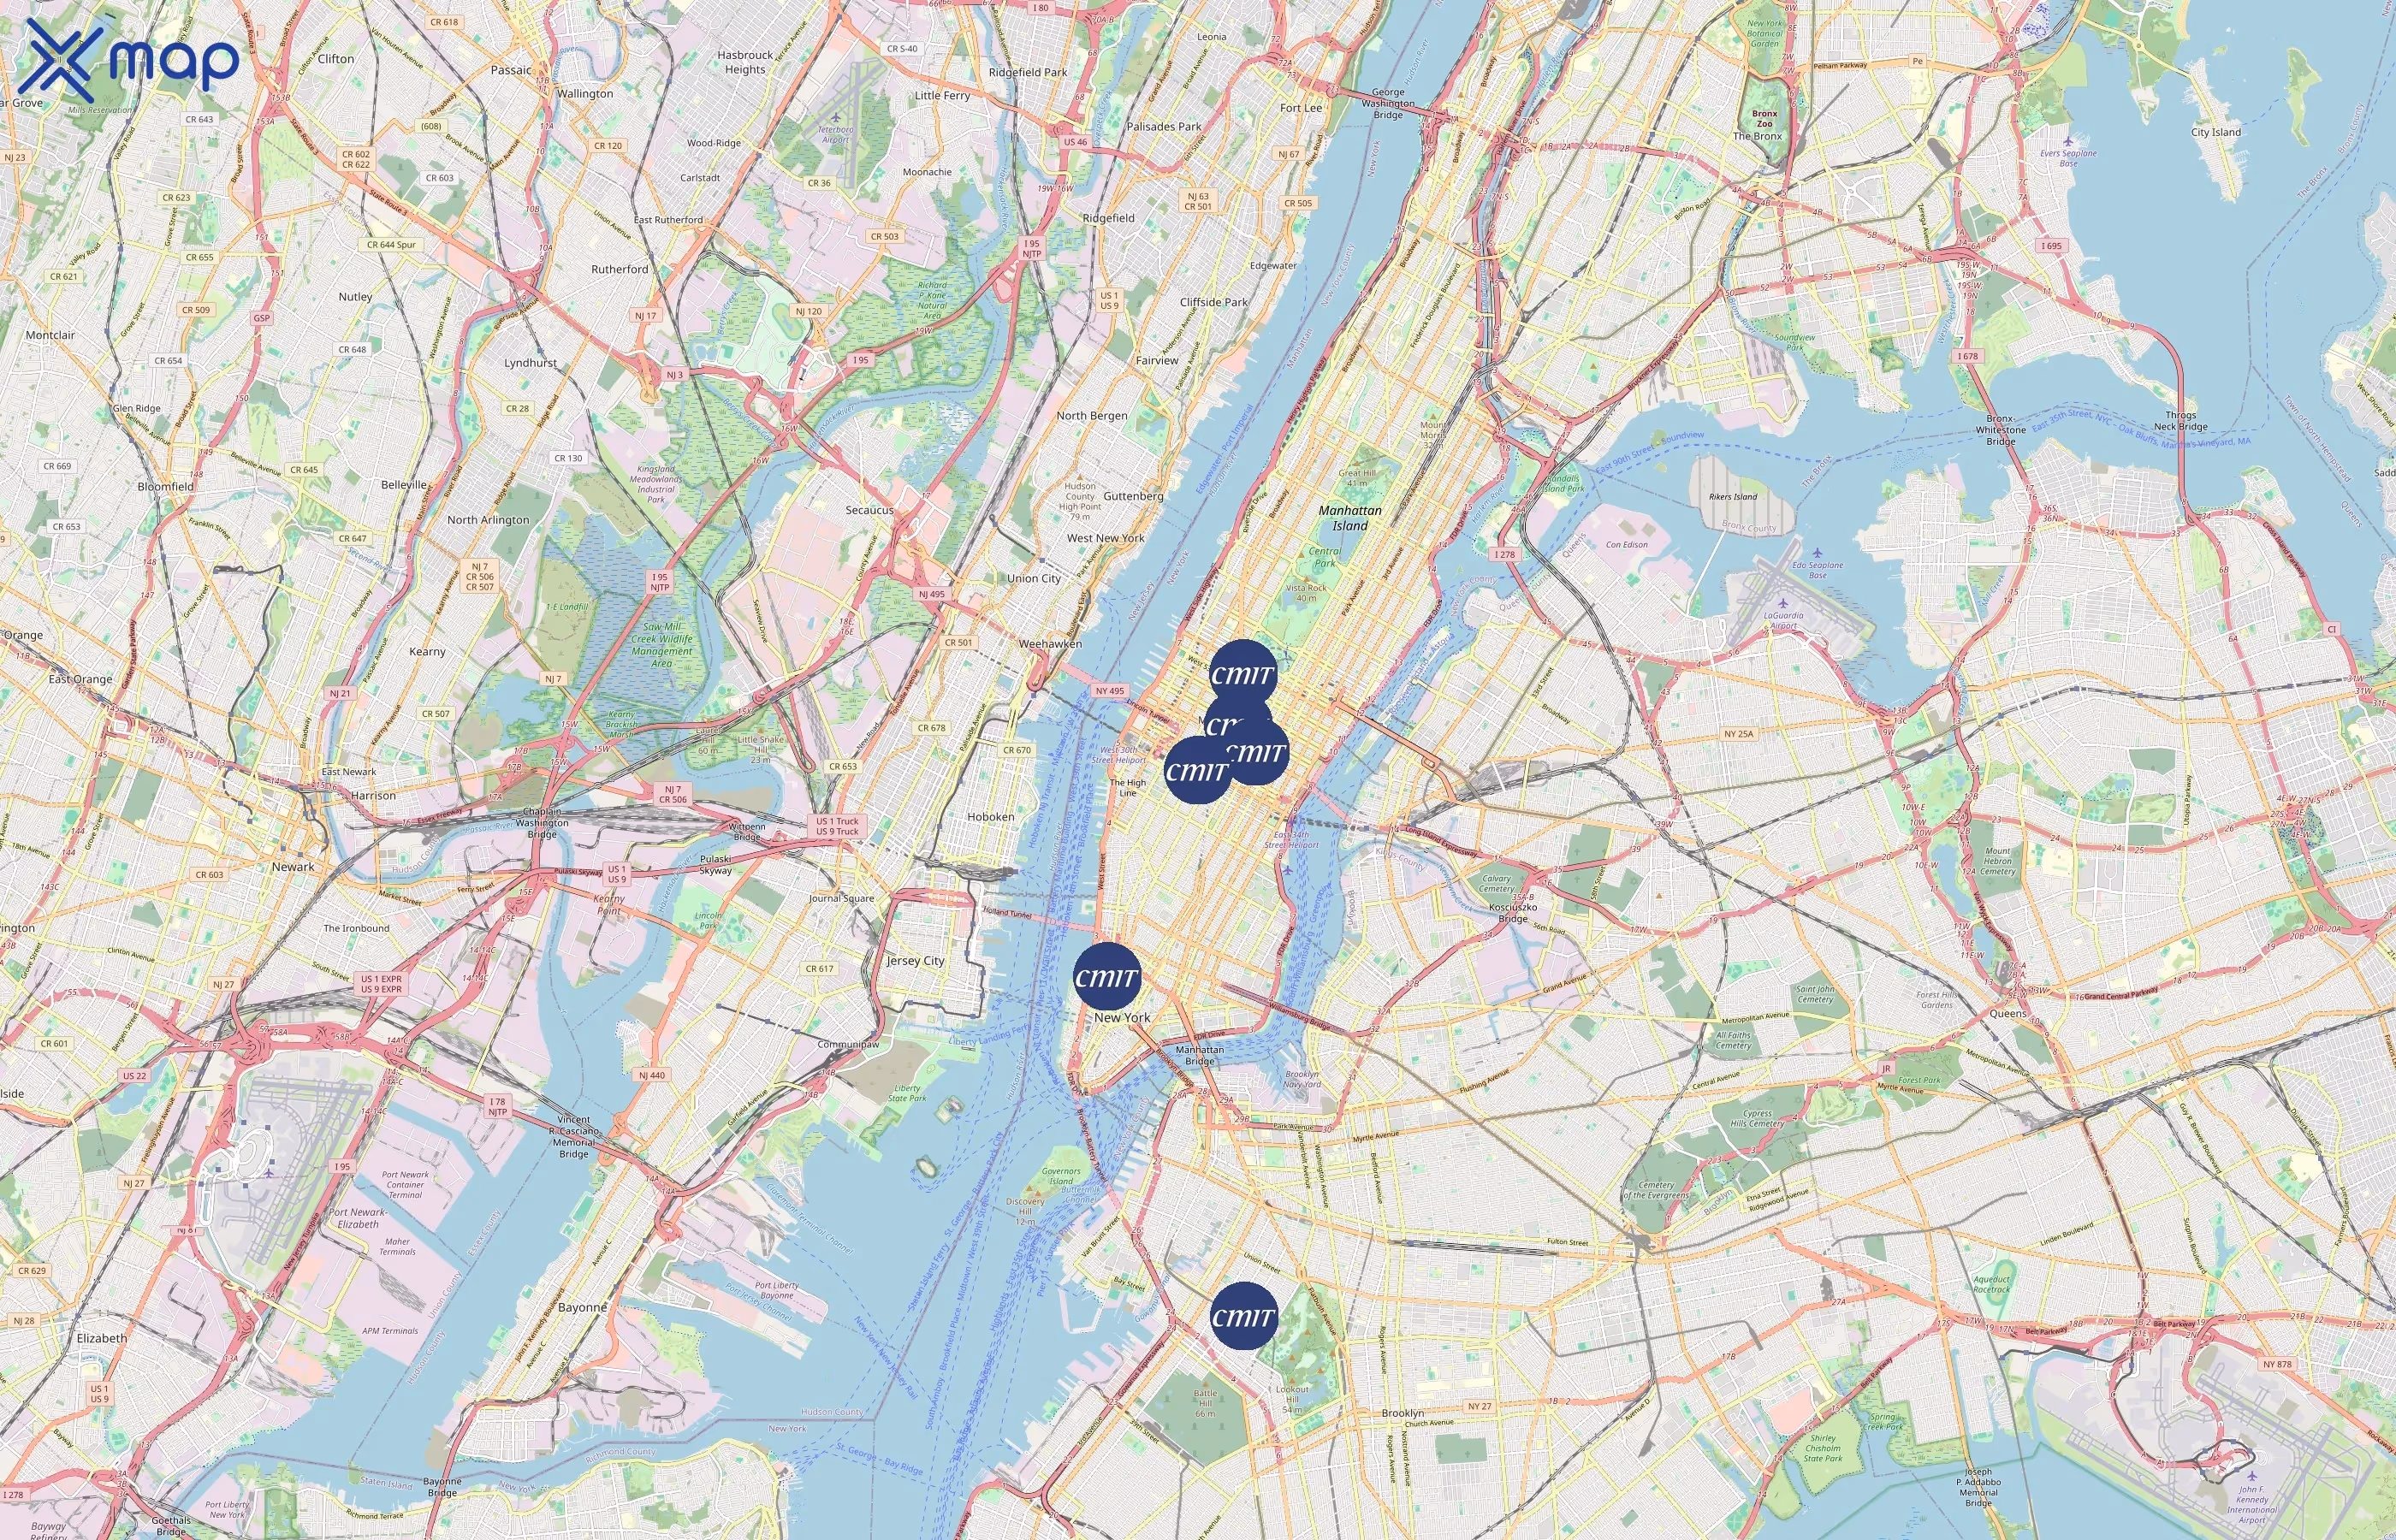
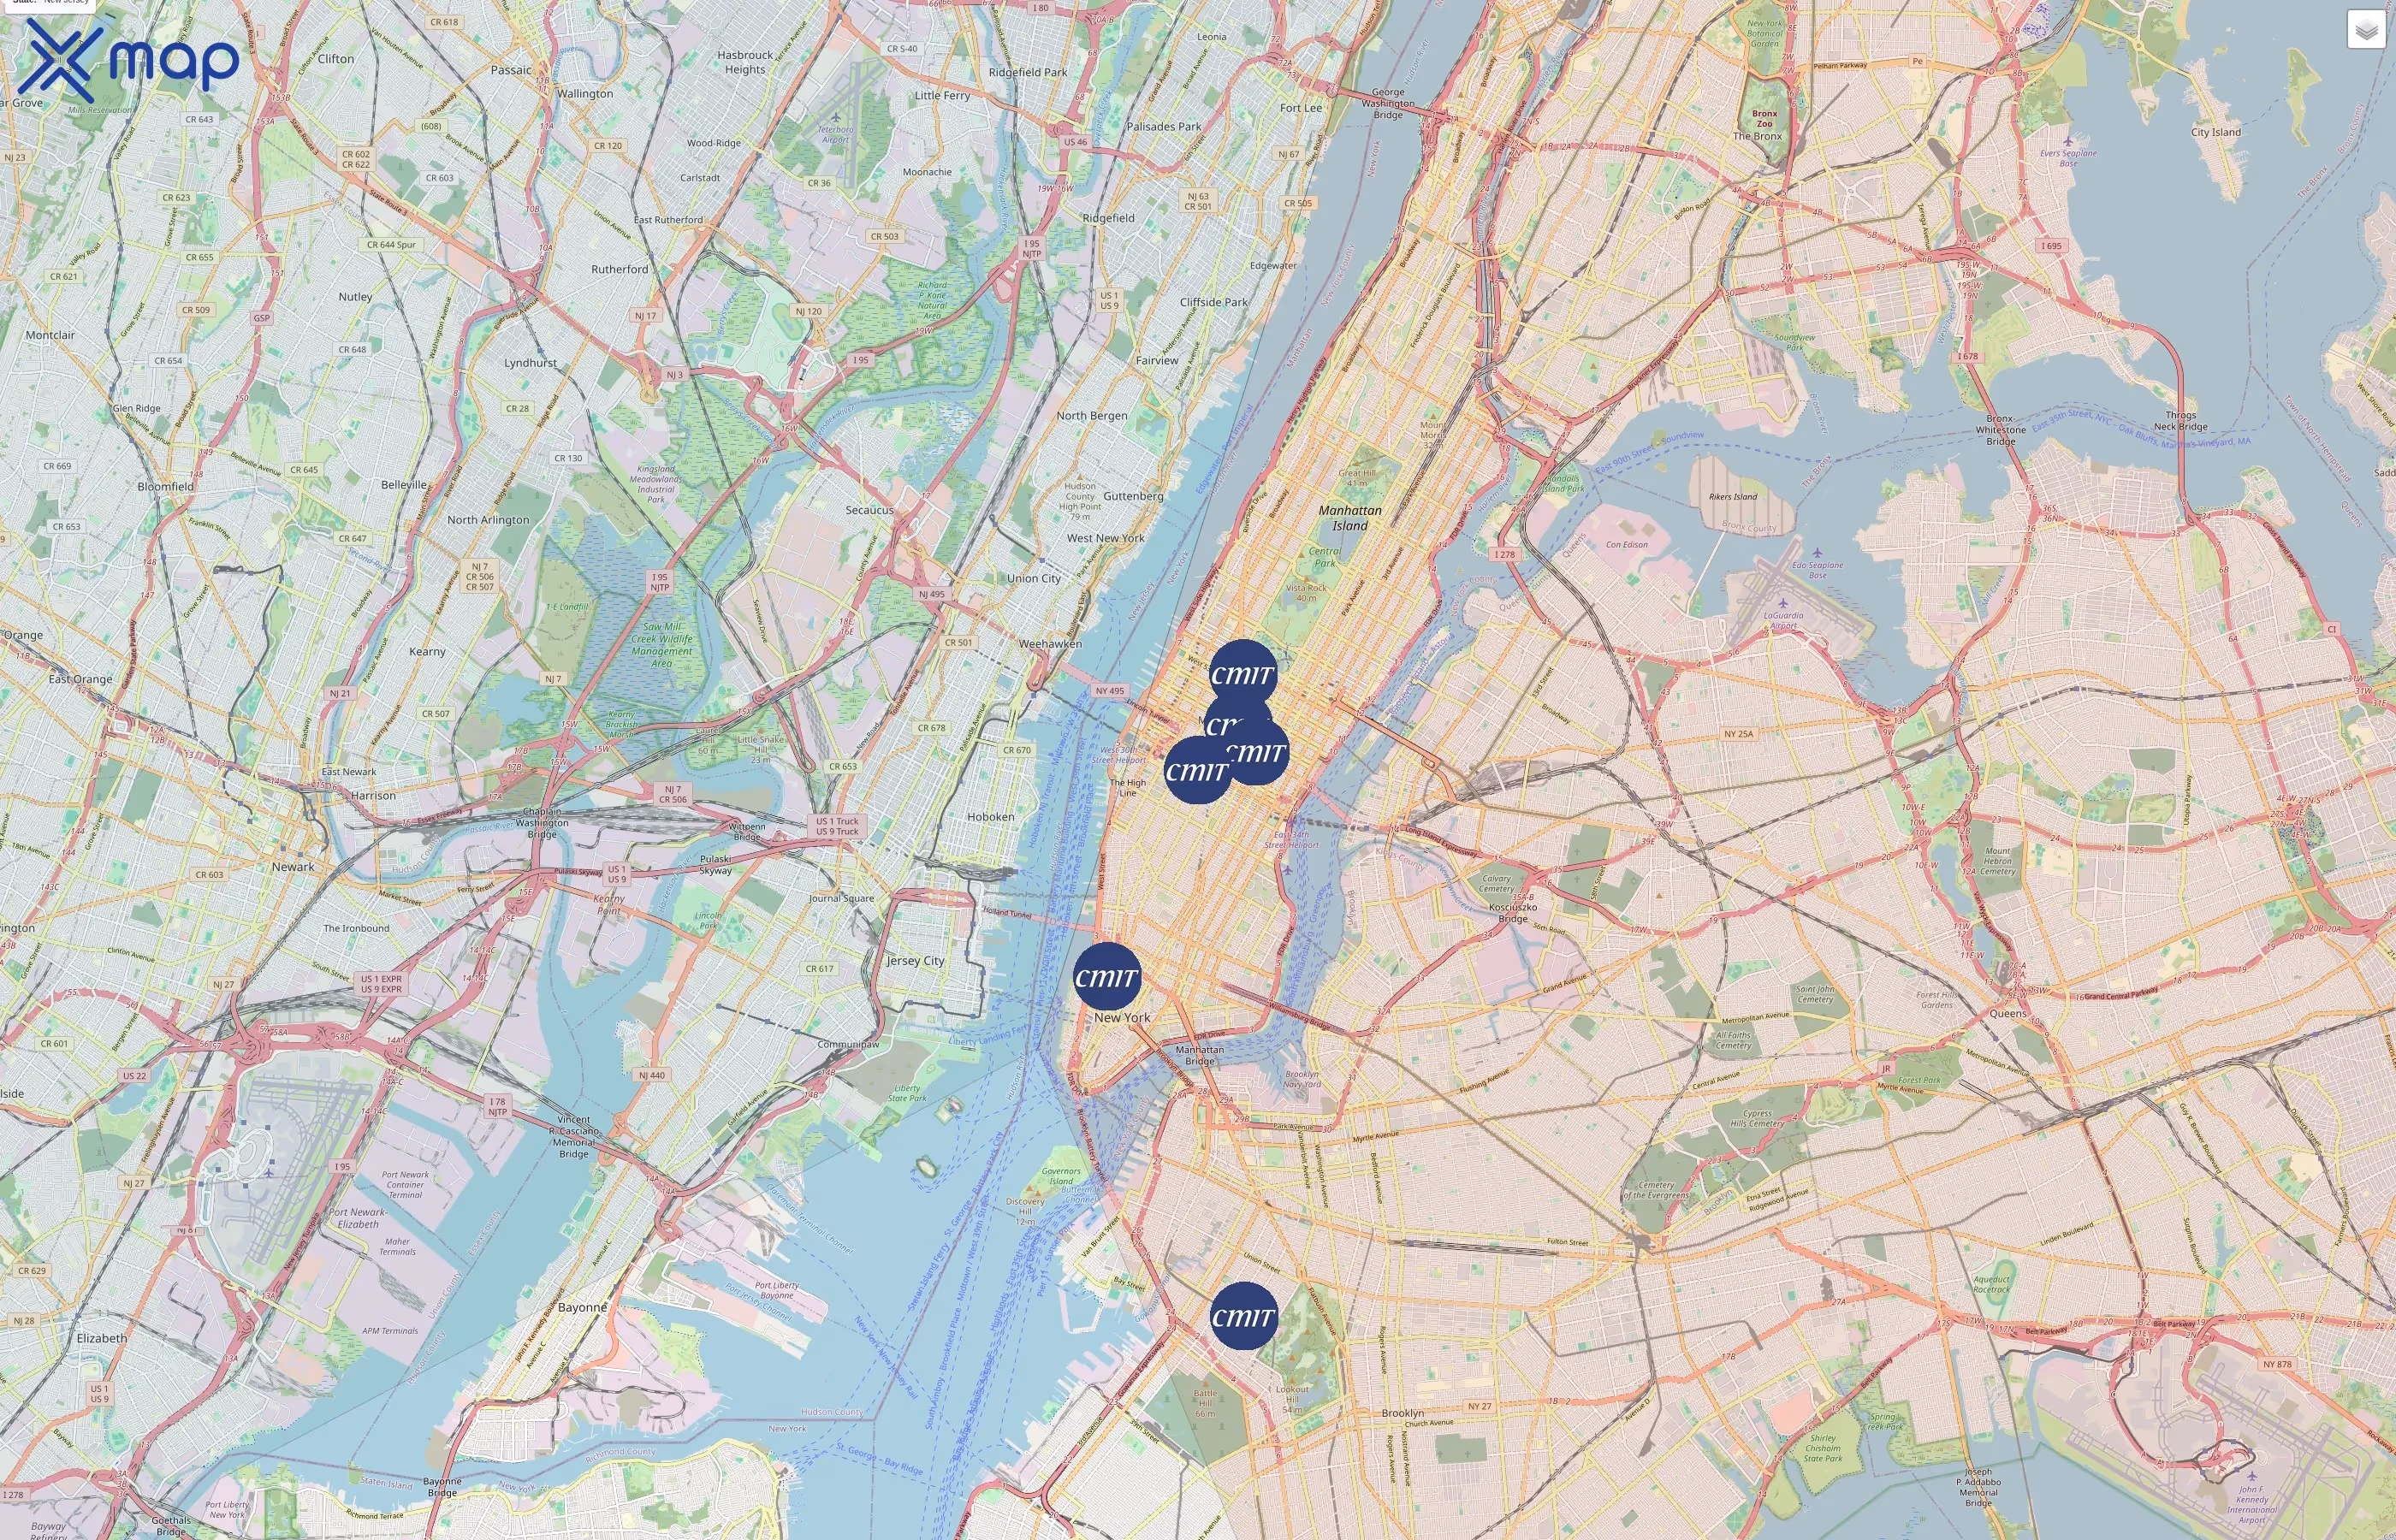
Street-level hotspots (busiest streets with multiple CMIT Solutions)
Street-level clusters show corridors where multiple CMIT Solutions locations sit within the same neighborhood indicating strong local presence and coherence. CMIT Solutions operates a total of 153 nationwide.
Download CMIT Solutions Outlets Points of Interest Data
The complete dataset of CMIT Solutions locations across the United States of America is available for download, including coordinates, traffic patterns, and operational status.
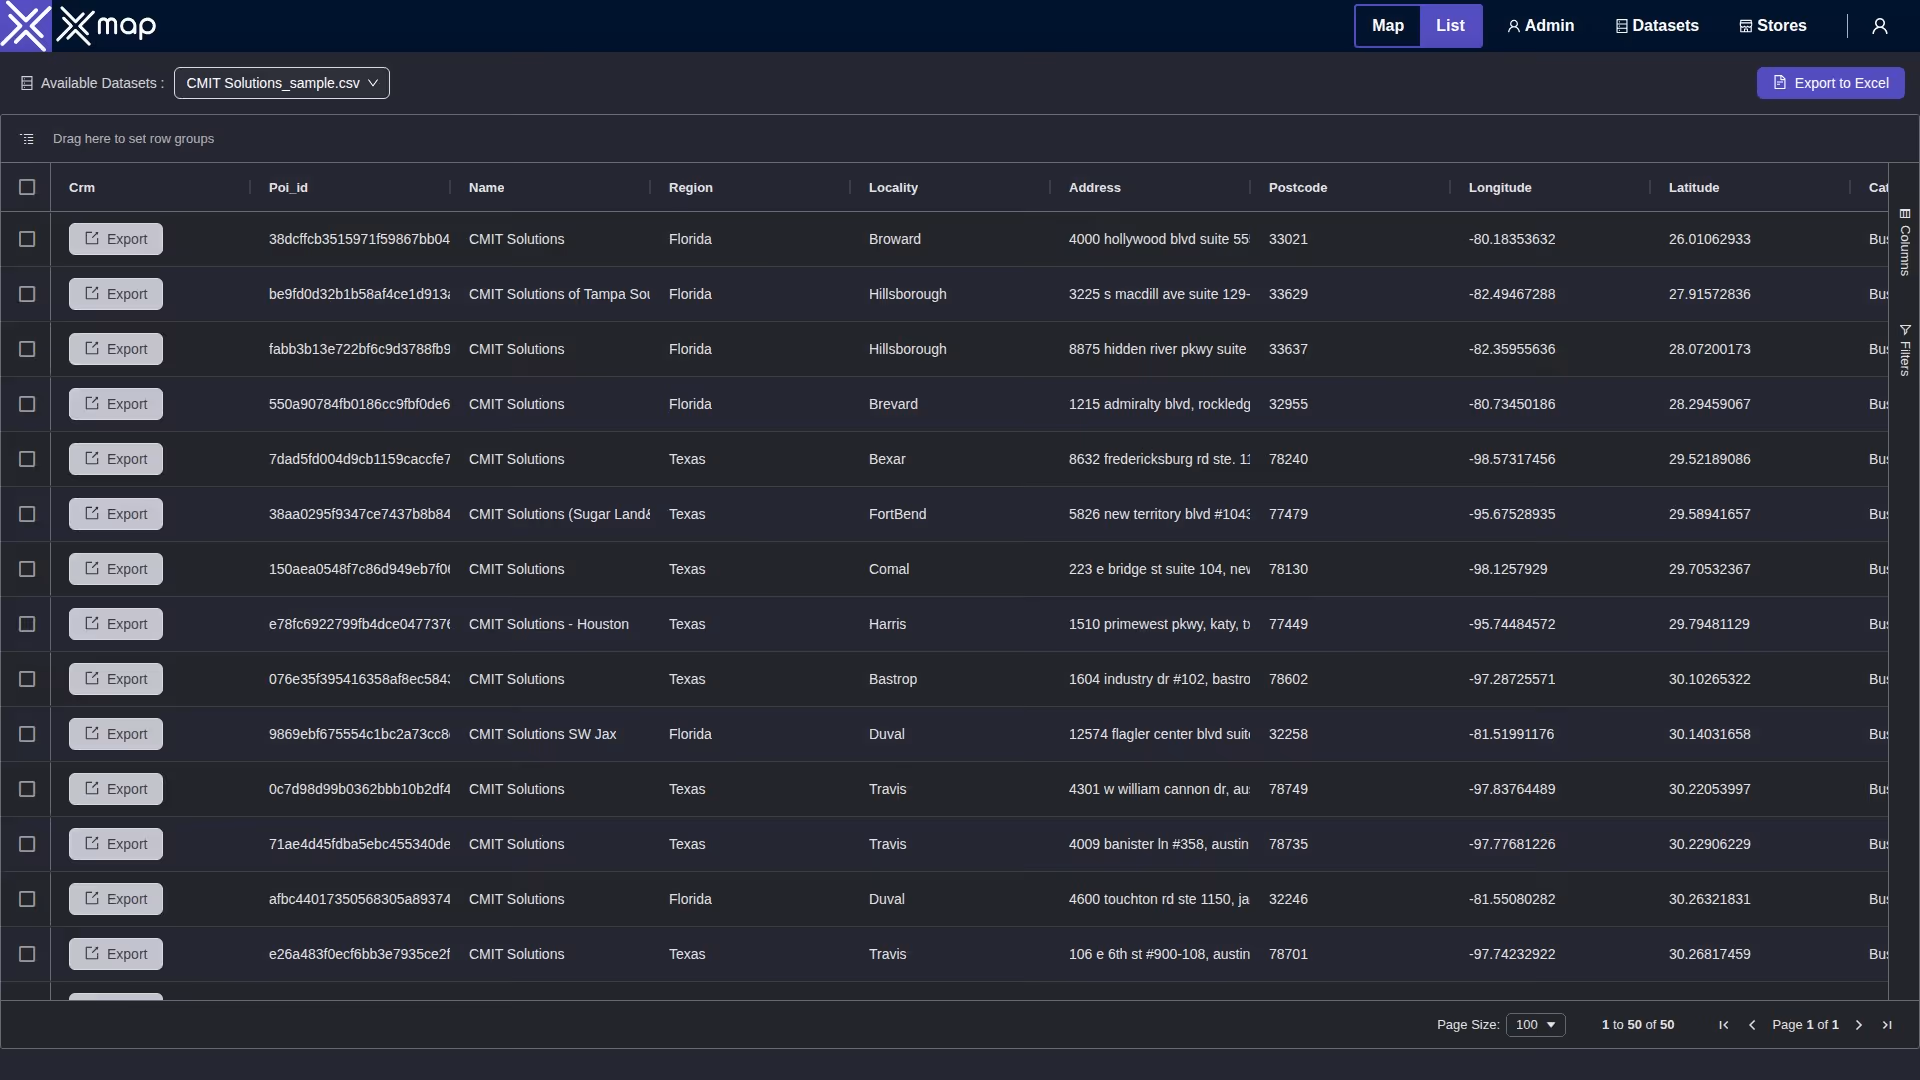
Key Variables for CMIT Solutions Points of Interests
CMIT Solutions has 153 locations across the United States of America. The key variables shows the most infleuntial aspects for CMIT Solutions locations nationwide. This provides a closer look of how CMIT Solutions is operating from different prespectives.
Average Area Covered Per CMIT Solutions Locations (By State)
CMIT Solutions' top states in the United States by land area include Texas, the largest at approximately 695,668 km² with 21 locations, and California with about 423,965 km² and 13 locations. Ohio is the smallest among the listed states with a land area of 116,098 km² and 10 locations. Some states like New York, New Jersey, and North Carolina have location counts but lack area data.
Business Status of CMIT Solutions Locations (Open vs Closed)
CMIT Solutions has a total of 104 locations across 10 states in the United States. California, New Jersey, Georgia, and North Carolina each have 100% of their locations open, with totals of 13, 10, 9, and 7 respectively. Texas has the highest number of locations at 21, but only 76.2% are open. Arizona shows the lowest open percentage at 42.9%, with 3 out of 7 locations currently open.
Traffic Data for CMIT Solutions Locations (By State)
This view compares activity near CMIT Solutions locations across states. Using traffic scores observed around 153 sites, it highlights the busiest markets, states with a high share of above-average locations, and areas where activity is comparatively light. Use it to benchmark performance, prioritize field operations, and spot expansion or optimization opportunities.
What CMIT Solutions locations are busy in top 10 states?
CMIT Solutions' busiest locations in the United States show Arizona and Illinois tied for the highest percentage of busy sites at 14.3%, each with 1 busy location out of 7 total. Texas has the greatest number of busy locations at 2, representing 9.5% of its 21 sites. Ohio follows with 1 busy location, accounting for 10% of its 10 total sites. Several states, including Georgia, California, North Carolina, New Jersey, and Pennsylvania, report no busy locations.
Customer Reviews and Ratings of CMIT Solutions Locations
This section summarizes customer sentiment toward CMIT Solutions. Using ratings and review totals from 153 locations, we highlight where scores are consistently high and where feedback volume is greatest. Average star ratings reflect perceived quality, while total reviews indicate engagement and reach across the network.
Average Ratings
CMIT Solutions achieved perfect average ratings of 5.0 in Arizona, Georgia, Illinois, New Jersey, and New York. Texas leads in review volume with 423, followed by New York with 222 and North Carolina with 147 reviews. California and New Jersey also have notable review counts of 108 and 103, respectively.
Number of Reviews
CMIT Solutions received the highest average ratings of 5.0 in Arizona, Georgia, Illinois, New Jersey, and New York. Texas led in total reviews with 423, followed by New York with 222 and North Carolina with 147. California and New Jersey contributed 108 and 103 reviews, respectively. These five states represent the largest shares of customer feedback for the brand in the United States.
CMIT Solutions Locations With Verified Contact Information
Contact Information
CMIT Solutions achieved 100% phone coverage in all listed states across the United States. Texas leads with 21 locations, followed by California and New York with 13 each. New Jersey and Ohio each have 10 locations fully covered by phone. Other states such as Georgia, Arizona, Illinois, North Carolina, and Pennsylvania maintain complete phone coverage with 7 to 9 locations each.
Use cases for CMIT Solutions Points of Interests Data
Market Analysis
CMIT Solutions POI data enables clear measurement of footprint and demand. Analysts can rank states and cities by location count, compare coverage on a per-capita basis, and use traffic scores and review volumes to spot high-performing markets and under-served pockets. The result is an objective view of saturation, growth opportunities, and performance outliers.
Site Selection
For network planning, the data supports scoring candidate trade areas using location density, population per location, and nearby traffic intensity. Teams can evaluate cannibalization risk via nearest-store distance, surface whitespace along key corridors, and prioritize sites near retail anchors, campuses, or transit where observed activity is strongest.
Urban Planning
Planners can map clusters and service gaps to understand commercial access at the neighborhood level. Per-capita coverage highlights communities with limited access, while changes in openings or closures signal shifts in activity. These insights inform corridor revitalization, streetscape and transit planning, and data-driven zoning decisions.
How this xMap's POI data can help businesses?
- Accuracy and Precision: xMap data offers high-accuracy data, which minimizes the chances of wrong decisions based on flawed information.
- Complete Data: With xMap, businesses have access to comprehensive and complete data, effectively filling any knowledge gaps and providing a well-rounded view for decision making.
- Up-to-Date Information: xMap ensures that the data provided is regularly updated, which allows businesses to make dynamic, timely decisions in tune with current trends and situations.
- Scalability: xMap data allows businesses to scale their operations efficiently, by providing insights that cater to varying business sizes and requirements.
- Analytical Power: Utilizing xMap data's analytics can help identify patterns and trends, thus enhancing strategic planning and foresight for businesses.
Download CMIT Solutions Point of Interest Data

Number of CMIT Solutions Locations in the United States of America
