How Many Subway Restaurants Are in the USA? F&B Insights
- Remove the current class from the content27_link item as Webflows native current state will automatically be applied.
- To add interactions which automatically expand and collapse sections in the table of contents, select the content27_h-trigger element, add an element trigger, and select Mouse click (tap).
- For the 1st click, select the custom animation Content 27 table of contents [Expand], and for the 2nd click, select the custom animation Content 27 table of contents [Collapse].
- In the Trigger Settings, deselect all checkboxes other than Desktop and above. This disables the interaction on tablet and below to prevent bugs when scrolling.
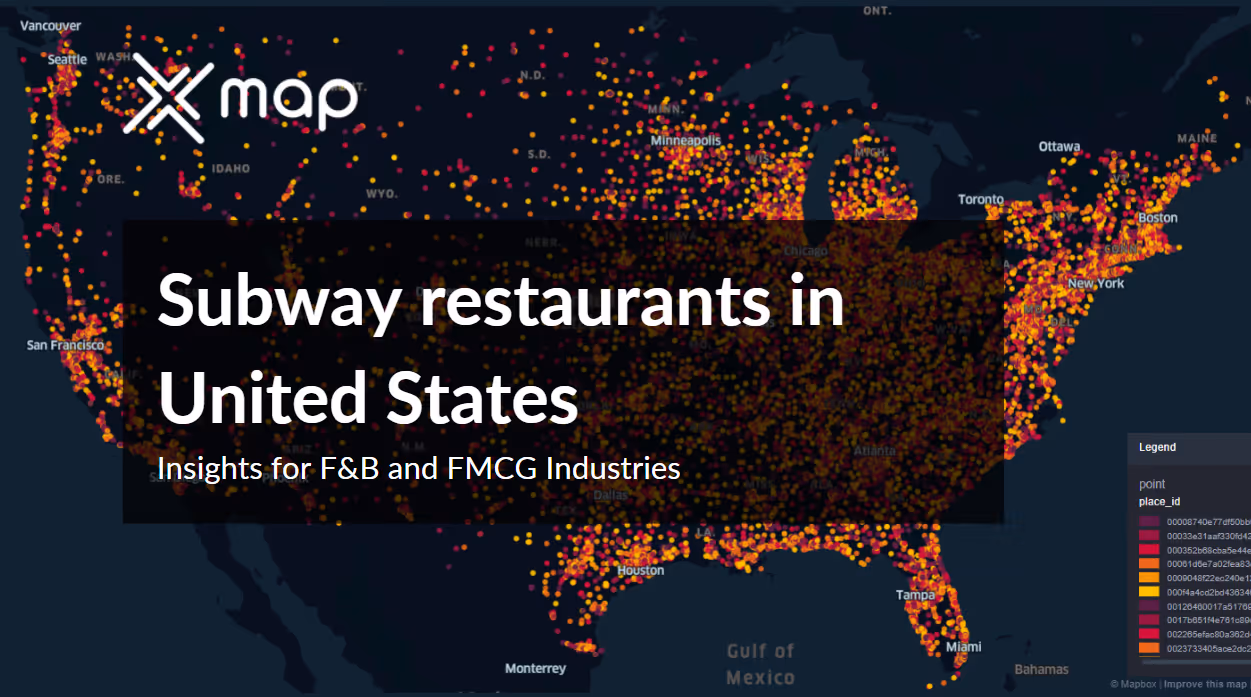
Subway, a leading name in the fast-food industry, has an extensive network of restaurants across the United States. This article offers key insights into the distribution, traffic patterns, and customer reviews of Subway locations, providing valuable information for the Food & Beverage (F&B) and Fast-Moving Consumer Goods (FMCG) industries. The data reveals significant regional concentrations, with California, Texas, and Florida having the highest number of establishments. Understanding these geospatial patterns and consumer behaviors is crucial for industry stakeholders aiming to optimize their market strategies and achieve success in the competitive F&B landscape.

Subway boasts an impressive presence in the United States with a total of 21,443 restaurants. This extensive network underscores Subway's dominance in the fast-food industry, providing widespread accessibility to its customers. The large number of locations highlights the brand's successful expansion strategy and its ability to cater to diverse regional markets across the country. This substantial footprint not only signifies Subway's popularity but also offers a vast array of data points for analyzing consumer behavior, regional preferences, and operational efficiency, making it a key player in the Food & Beverage (F&B) and Fast-Moving Consumer Goods (FMCG) industries.
Distribution of Subway restaurants in United States by States

The regional distribution of Subway restaurants across the United States reflects distinct patterns shaped by population density, consumer behavior, and regional demand. California leads with 2,194 locations, reinforcing its role as a high-consumption market and a strategic foothold on the West Coast. Texas, with 1,788 restaurants, underscores the brand’s deep-rooted presence in the Southern U.S., driven by its vast area and demographic diversity. Florida follows with 1,301 outlets, illustrating strong demand in the Southeastern region, especially among a mix of residents and tourists. In the Midwest, Ohio and Illinois report 983 and 913 locations respectively, highlighting Subway's well established networks in urban and suburban settings.
This widespread footprint reveals the brand’s broad market penetration and provides a framework for analyzing regional consumer preferences, sales performance, and operational strategies. Recognizing these location-based patterns helps F&B stakeholders refine site selection, align marketing approaches, and optimize resource allocation in the competitive fast-food sector.
Decoding Geospatial Data for United States Subway restaurants
Traffic Data

The degree of customer interaction at Subway branches varies across the United States, with 13,809 stores showing above-average visitation rates, demonstrating a dedicated and loyal customer following. Furthermore, 1,143 dining establishments draw in many patrons due to their strategic locations, successful marketing strategies, and close connections to the community. On the other hand, 346 companies show moderate customer interest and growth potential through specific strategies, indicated by their average number of customers visiting their premises. This data about customer interaction with Subway's platform aids individuals in the Food & Beverage (F&B) and Fast-Moving Consumer Goods (FMCG) sectors by assisting them in making informed decisions on resource allocation, creating effective marketing strategies, and implementing operational enhancements to boost profits and customer happiness.
Price Range
Subway restaurants across the United States consistently maintain a position in the low-cost dining segment, making affordability a defining aspect of the brand. This accessible pricing strategy enhances Subway’s broad customer appeal, attracting a diverse audience from working professionals to students and families. By offering competitively priced menu options, Subway strengthens its foothold in the fast-food industry, especially among budget-conscious consumers. This approach not only supports customer retention through frequent visits but also reinforces Subway’s identity as a reliable, affordable meal choice within a crowded F&B market.
Number of Reviews

The number of reviews for Subway restaurants in the United States varies significantly, ranging from just 1 to as many as 2,804 reviews per establishment. Notably, 11,645 of these locations have garnered over 100 reviews each. This substantial volume of customer feedback highlights the active engagement of Subway's customer base and provides a wealth of data for analyzing consumer satisfaction and preferences. High review counts often correlate with higher foot traffic and visibility, indicating popular and frequently visited locations. This extensive customer feedback is invaluable for Subway and industry stakeholders, offering insights into operational performance, customer service quality, and areas for improvement to enhance the overall dining experience.
Leveraging Geospatial Intelligence for F&B Success in United States
Competitive Analysis
Geospatial intelligence allows F&B businesses to perform detailed competitive analysis through mapping competitor locations, evaluating their market share, and pinpointing areas of market saturation. This understanding enables companies to distinguish their products and create special value propositions to draw in customers.
Risk Mitigation
Using geospatial data assists in pinpointing possible hazards like natural calamities, environmental issues, or socio-economic aspects that could affect business activities. This proactive strategy enables businesses to execute contingency plans and manage risks efficiently.
Expansion Strategy
Geospatial analysis aids in developing a successful growth strategy by identifying unexplored or flourishing markets. Businesses can use this information to prioritize their expansion efforts, efficiently allocate resources, and capitalize on emerging opportunities in various locations.
Customer Segmentation
Geospatial intelligence allows for precise customer segmentation by analyzing demographic information, socio-economic factors, and behavioral trends in specific geographical areas. This department enables businesses to tailor marketing tactics, product options, and offers to effectively target particular customer groups.
Conclusion
In conclusion, Subway's extensive network of 21,000+ restaurants in the United States underscores its dominance in fast food. This article provides insights into distribution, traffic patterns, and customer reviews crucial for F&B and FMCG stakeholders. Key markets like California, Texas, and Florida show substantial presence, reflecting Subway's strategic market penetration. The brand's affordability, strong customer engagement, and comprehensive review data highlight its popularity and operational efficiency, shaping industry standards nationwide. Leveraging geospatial intelligence enhances competitive analysis, risk management, and expansion strategies, crucial for sustained success in the dynamic F&B landscape. For businesses assessing global performance, this overview of Subway's footprint in the UK offers valuable comparative insights into market saturation and regional growth dynamics.
Leveraging xMap for F&B Businesses in United States
- Optimized Location Planning: xMap identifies prime locations for new outlets based on demographics, competitor proximity, and foot traffic patterns.
- Targeted Marketing Campaigns: Utilize xMap for precise geographic targeting in marketing campaigns, tailoring promotions to local consumer preferences.
- Continuous Data Updates: xMap provides real-time data updates on demographics, consumer behavior, and market trends, ensuring businesses have the latest insights for informed decision-making.
- Operational Efficiency: xMap streamlines supply chain logistics and inventory management by optimizing delivery routes and distribution strategies.
- Competitive Analysis: Map competitor locations and assess market saturation to identify strategic opportunities for differentiation and expansion.
Subscribe for advanced Data analysis Tips and Reports

Get in Touch
Whatever your goal or project size, we will handle it.
We will ensure you 100% satisfication.
"We focus on delivering quality data tailored to businesses needs from all around the world. Whether you are a restaurant, a hotel, or even a gym, you can empower your operations' decisions with geo-data.”

