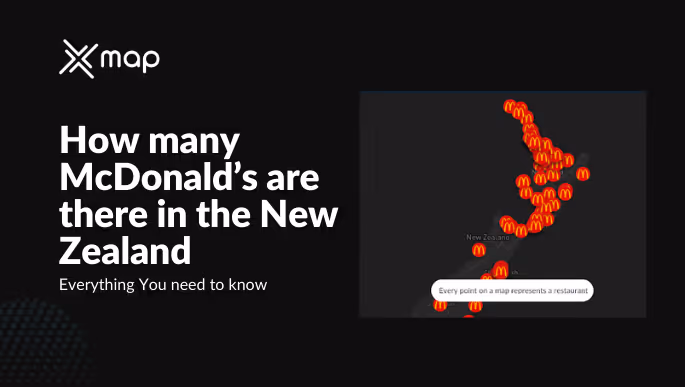
How many McDonald's are there in New Zealand? | All You need to know
- Remove the current class from the content27_link item as Webflows native current state will automatically be applied.
- To add interactions which automatically expand and collapse sections in the table of contents, select the content27_h-trigger element, add an element trigger, and select Mouse click (tap).
- For the 1st click, select the custom animation Content 27 table of contents [Expand], and for the 2nd click, select the custom animation Content 27 table of contents [Collapse].
- In the Trigger Settings, deselect all checkboxes other than Desktop and above. This disables the interaction on tablet and below to prevent bugs when scrolling.
Number of McDonald’s Locations in New Zealand
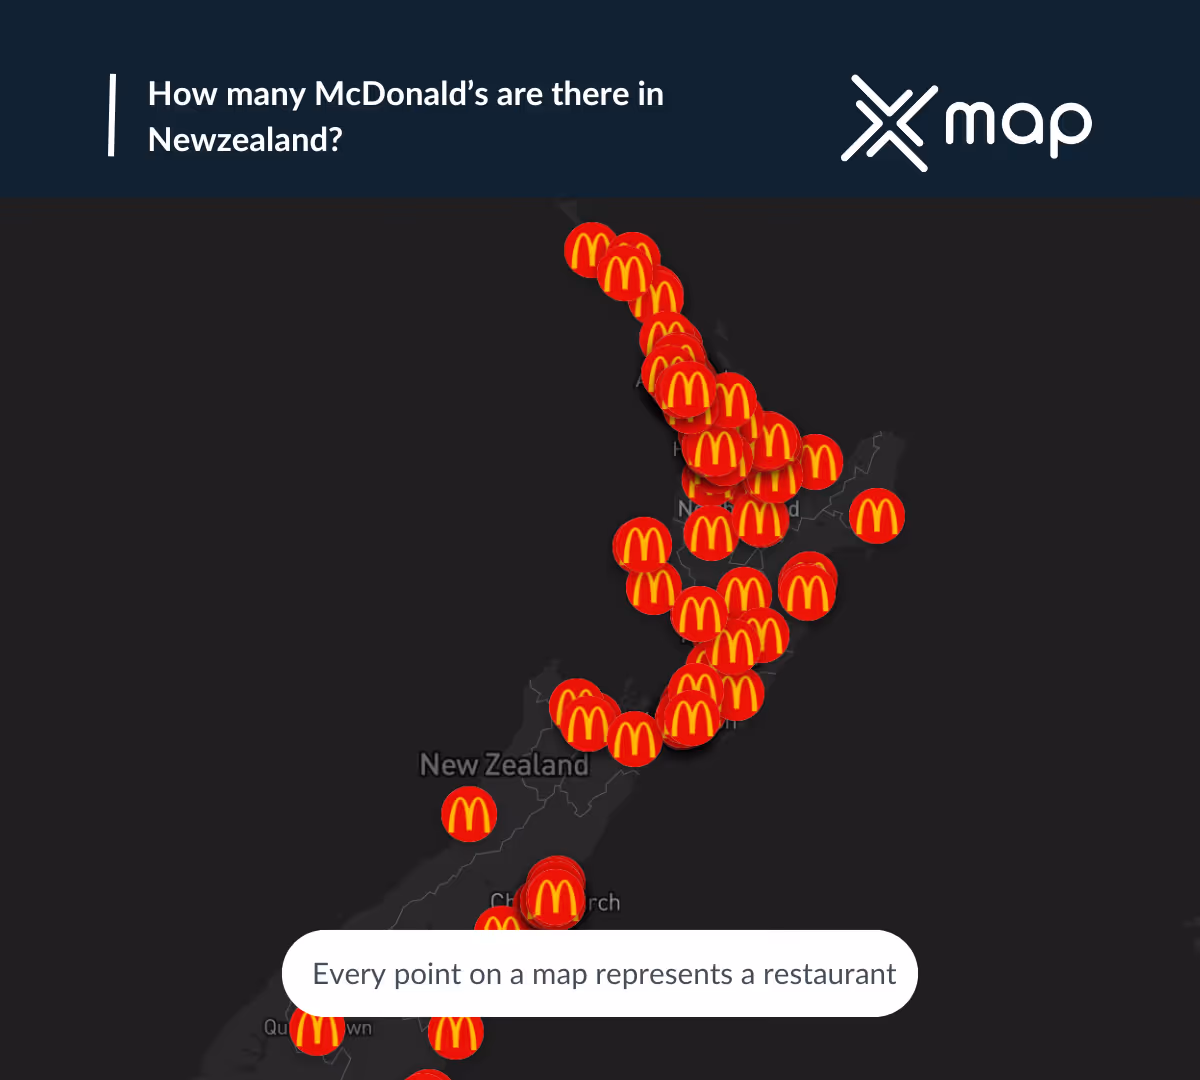
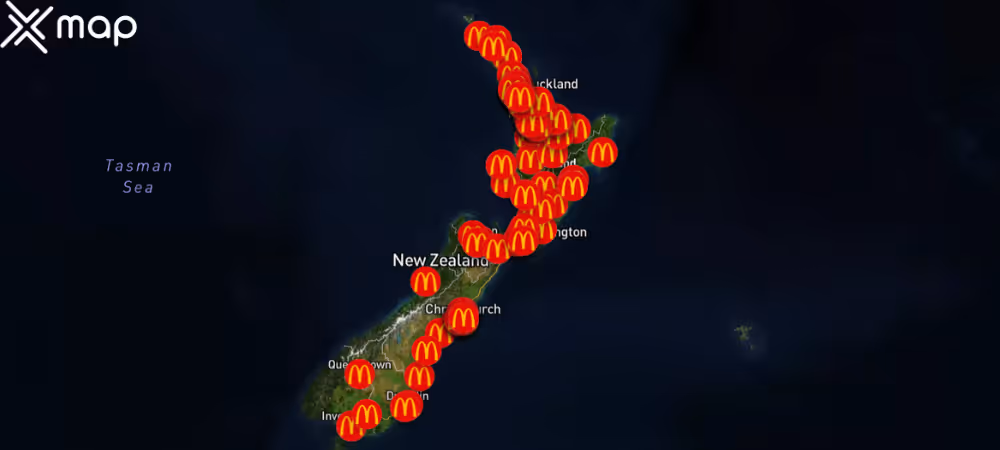
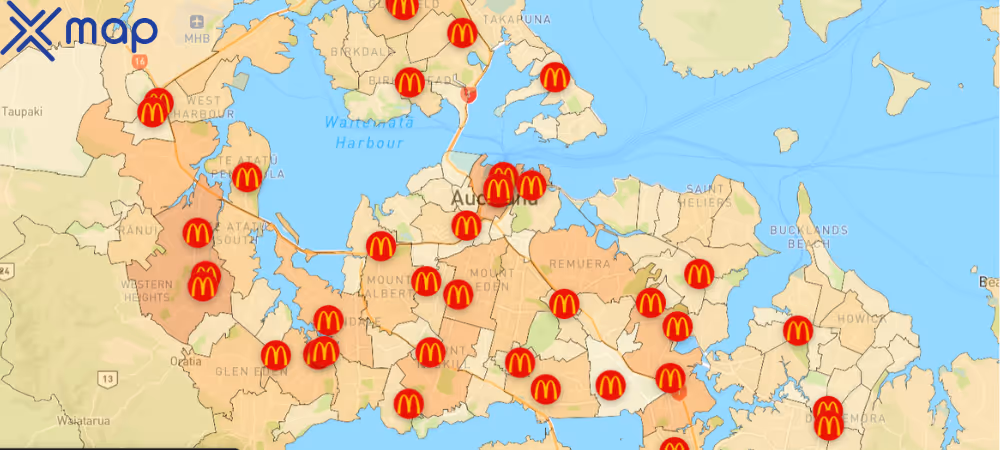
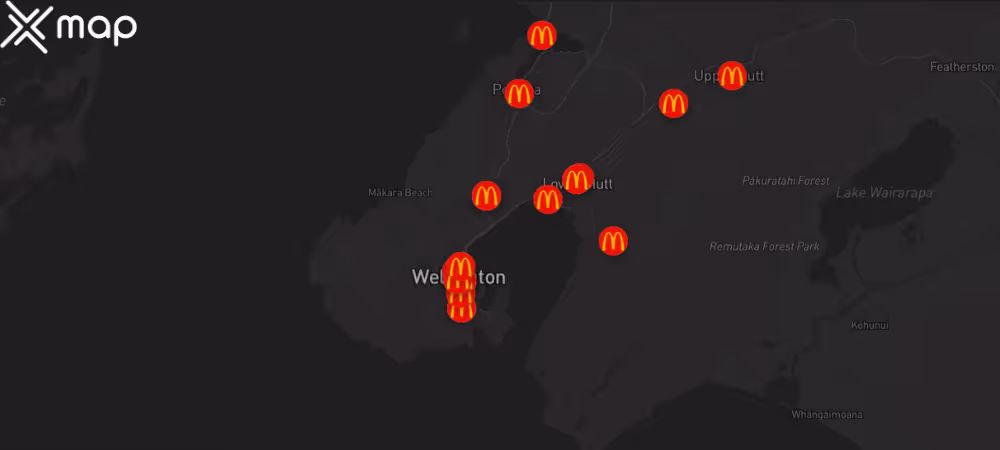
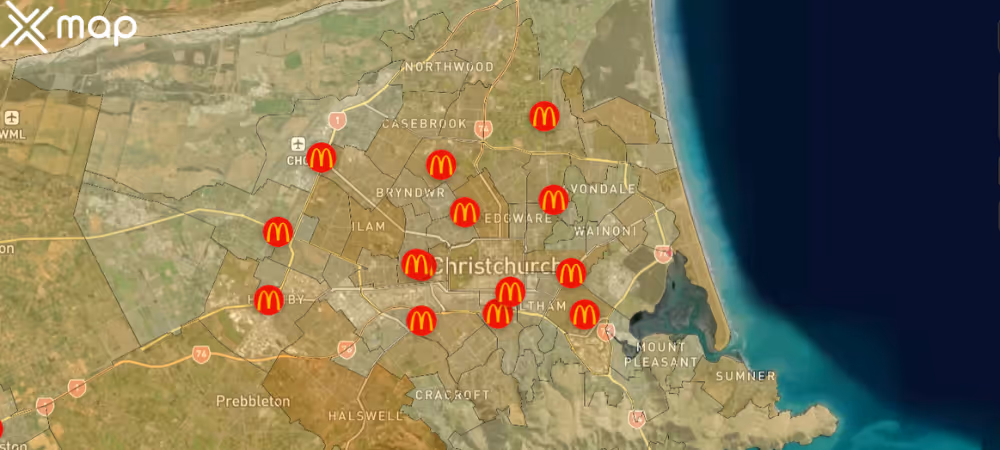
There are 183 McDonald’s locations in New Zealand as of 2025-12-11. The region with the most locations is Auckland, with 69 sites, accounting for 37.7% of all locations.
Key Stats:
Locations with Ratings: 183
Locations with Phone Numbers: 182
Locations with Websites: 183
Closed Locations: 12
Distribution of McDonald’s Locations Across New Zealand by Region
The largest clusters of McDonald’s locations are found in Auckland and Canterbury. Across the country, the top 10 regions account for 93.99% of all sites, highlighting a strong concentration in major population centres. Coverage is thinner in regions such as Marlborough and West Coast, where store counts remain comparatively low.
Top 10 Regions with the most number of McDonald’s locations in New Zealand
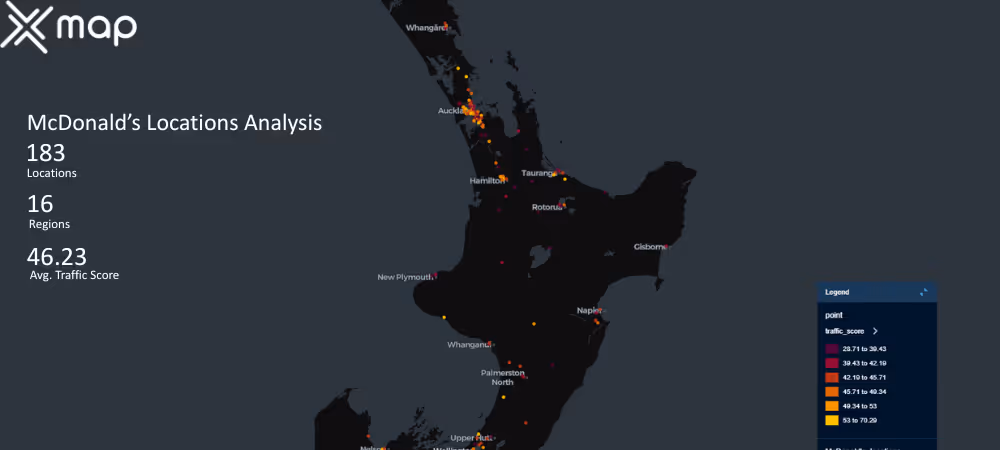
McDonald’s shows strong visitor engagement across New Zealand: 72 locations operate above the national mean traffic score (mean: 46.23), and 0 sites qualify as highly visited based on traffic values of 80 or higher.
McDonald’s has a total of 183 locations across New Zealand, with Auckland leading at 69 sites, representing 37.7% of the national network. The top three regions (Auckland, Canterbury, Waikato) account for 60.66% of all locations, reflecting a strong concentration in major population centres. Regions offering the best access per capita include Tasman, Manawatu-Wanganui, Waikato, each with relatively low population per location, while areas such as Gisborne, Marlborough, Otago are the most stretched, having the highest population per McDonald’s site.
McDonald’s Per Capita Insights
- Regions Auckland, Canterbury, Waikato enjoy the strongest per-capita access to McDonald’s.
- Regions such as Gisborne, Marlborough, West Coast are comparatively under-served.
City’s With the Most McDonald’s Locations in New Zealand
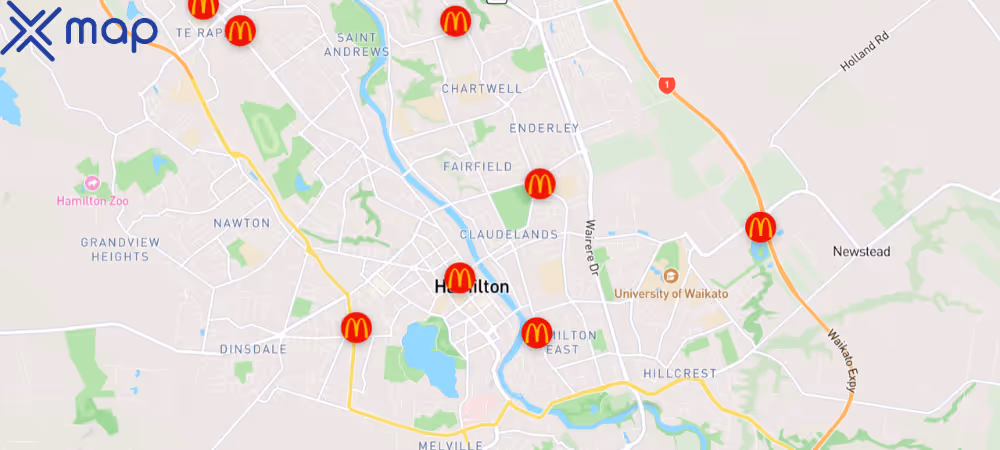
Locations are heavily concentrated in key urban centres such as Auckland, Christchurch, Hamilton, and Wellington. The top 10 cities collectively account for 67.76% of all McDonald’s locations, highlighting a strong urban footprint and reliance on major population hubs.
Top 10 Cities Ranked by Location Count
Urban centres play a major role in McDonald’s’s footprint. The top 10 cities account for 67.76% of all locations, highlighting a strong concentration in metropolitan or high-population corridors. Auckland leads as the most represented city, followed by Christchurch and Hamilton, each with substantial store counts.
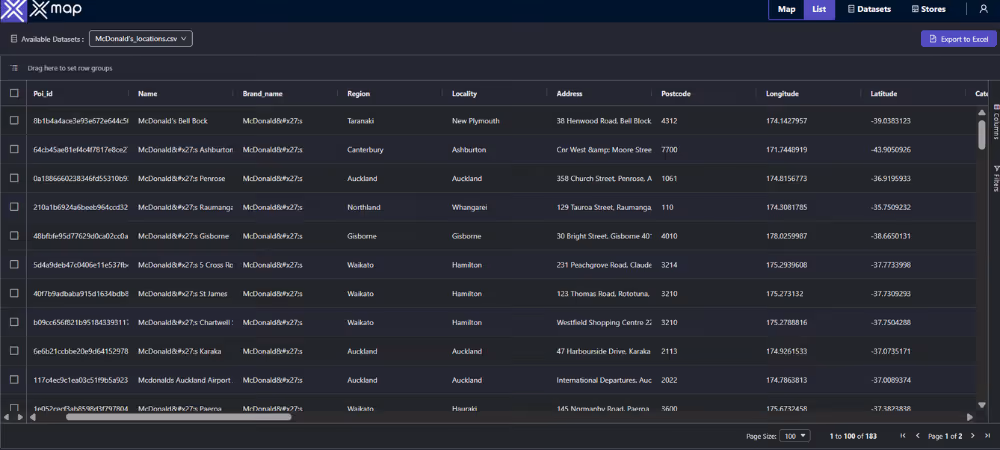
Download McDonald’s Outlets Points of Interest Data
The complete dataset of McDonald’s locations across New Zealand is available for download including coordinates, traffic patterns, and operational status.
Key Variables for McDonald’s Points of Interests
The key variables shows the most influential aspects for McDonald’s locations nationwide. This provides a closer look of how McDonald’s is operating from different perspectives.
Average Area Covered Per McDonald’s Locations (By Region)
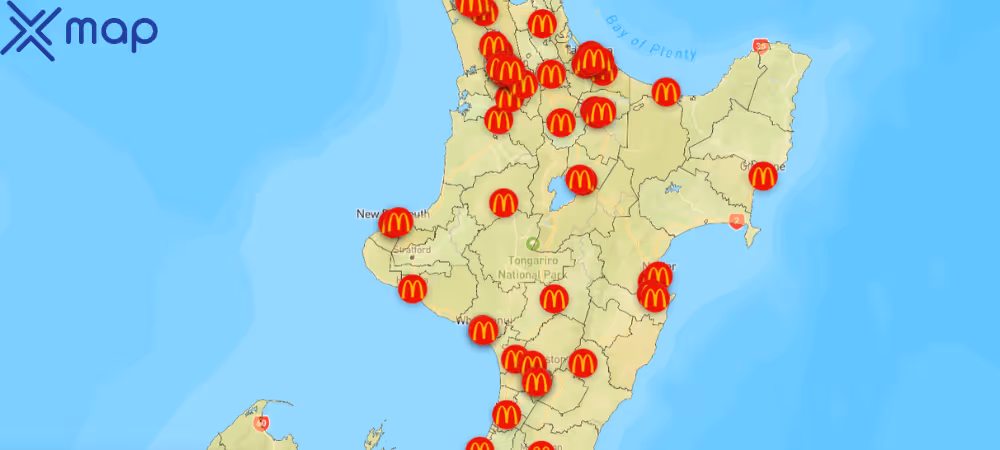
McDonald’s locations across New Zealand span regions with significantly different land areas. Canterbury is the largest region, covering 44,504 km² with 21 McDonald’s locations. In contrast, Nelson, the smallest region at 422 km², hosts 2 locations. Despite its smaller land area, Auckland contains the highest number of McDonald’s stores with 69 outlets in total. Other regions such as Waikato, Bay of Plenty, and Wellington also show strong McDonald’s presence relative to their land sizes.
Business Status of McDonald’s Locations (Open vs Closed)
Operational status remains overwhelmingly stable, with 171 active locations and only 12 listed as closed across all regions. Most regions report 100% operational sites, reinforcing the network’s consistent presence and limited disruption from permanent closures.
Traffic Data for McDonald’s Locations (By Region)
This view compares activity near McDonald’s locations across regions. Using traffic scores observed around 183 sites, it highlights the busiest markets, states with a high share of above-average locations, and areas where activity is comparatively light. Use it to benchmark performance, prioritize field operations, and spot expansion or optimization opportunities.
What McDonald’s locations are busy in the top 10 regions?
Analysis of busy locations — defined as stores above the national mean traffic score of 46.23 — shows that activity is not evenly distributed. The regions with the highest number of busy locations strongly mirror overall store count leaders, suggesting that larger markets also sustain higher visitor engagement. This alignment indicates efficient placement and strong brand penetration in top regions.
Customer Reviews and Ratings
This section summarizes customer sentiment toward McDonald’s. Using ratings and review totals from 183 locations, we highlight where scores are consistently high and where feedback volume is greatest. Average star ratings reflect perceived quality, while total reviews indicate engagement and reach across the network
Average Ratings
Meanwhile, Nelson holds the highest average rating at 3.85 stars, suggesting particularly positive sentiment in that region.
Number of Reviews
Customer feedback highlights both engagement volume and perceived quality. Auckland generates the highest number of total reviews at 111,544, indicating a large and active customer base.
Use Cases for McDonald’s Points of Interest Data
Market Analysis
McDonald’s POI data enables clear measurement of footprint and demand. Analysts can rank states and cities by location count, compare coverage on a per-capita basis, and use traffic scores and review volumes to spot high-performing markets and under-served pockets. The result is an objective view of saturation, growth opportunities, and performance outliers.
Site Selection
For network planning, the data supports scoring candidate trade areas using location density, population per location, and nearby traffic intensity. Teams can evaluate cannibalization risk via nearest-store distance, surface whitespace along key corridors, and prioritize sites near retail anchors, campuses, or transit where observed activity is strongest.
Urban Planning
Planners can map clusters and service gaps to understand commercial access at the neighborhood level. Per-capita coverage highlights communities with limited access, while changes in openings or closures signal shifts in activity. These insights inform corridor revitalization, streetscape and transit planning, and data-driven zoning decisions.
How this xMap’s POI data can help businesses?
Accuracy and Precision:
xMap data offers high-accuracy data, which minimizes the chances of wrong decisions based on flawed information.
Complete Data:
With xMap, businesses have access to comprehensive and complete data, effectively filling any knowledge gaps and providing a well-rounded view for decision making.
Up-to-Date Information:
xMap ensures that the data provided is regularly updated, which allows businesses to make dynamic, timely decisions in tune with current trends and situations.
Scalability:
xMap data allows businesses to scale their operations efficiently, by providing insights that cater to varying business sizes and requirements.
Analytical Power:
Utilizing xMap data’s analytics can help identify patterns and trends, thus enhancing strategic planning and foresight for businesses.
Subscribe for advanced Data analysis Tips and Reports

Get in Touch
Whatever your goal or project size, we will handle it.
We will ensure you 100% satisfication.
"We focus on delivering quality data tailored to businesses needs from all around the world. Whether you are a restaurant, a hotel, or even a gym, you can empower your operations' decisions with geo-data.”

