Retail Site Selection: A Comprehensive Data-Driven Guide
Master Retail Site Selection: Data-driven tactics to decode demographics, competition, and trends, ensuring prime locations for maximum profits
Selecting the ideal retail location is pivotal to success, riddled with challenges. Data-driven decisions offer insights into demographics, competition, and trends, ensuring informed and strategic choices.
In this article, we will show how to harness the power of isochrone mapping, attribute population, regression modeling, and explainability to make calculated decisions, identify strategic locations, and forecast profitability.
Understanding the demographics of a new location involves analyzing a wide range of variables like age, income, cultural preferences, and lifestyle. These factors can significantly affect the demand for your product or services.
Markets can vary significantly from one location to another. Consumer behavior, spending patterns, and trends can change dramatically even within a single city, making it crucial to gather localized data.
Assessing the competitive landscape in a new location is complex. Identifying existing competitors, their strengths, and weaknesses can help you determine if there's room for your business.
The availability and quality of transportation, distribution networks, and infrastructure can impact your operational efficiency and ability to serve customers effectively.
The presence or absence of amenities like shopping centers, schools, recreational facilities, and public transportation can impact foot traffic and customer accessibility.
Rapidly evolving consumer trends and technology adoption can make it challenging to predict long-term demand accurately.
Data availability, accuracy, and reliability can vary across regions, making it challenging to make well-informed decisions based on incomplete or inconsistent data.
Some factors, such as unforeseen local events, political instability, or social dynamics, can have unexpected effects on your business in a particular location.
When entering a new market, you may have limited historical performance data to base your decisions on, making predictions more uncertain.
Choosing a location often involves long-term leases or property purchases, making it challenging to quickly reverse a decision if it proves suboptimal.
Decision-making requires finding the right balance between various conflicting factors, such as cost, accessibility, customer demographics, and competition.
Step 1: Define Expansion Goals: Clearly outline the number of new locations you intend to open and the desired timeline for implementation.
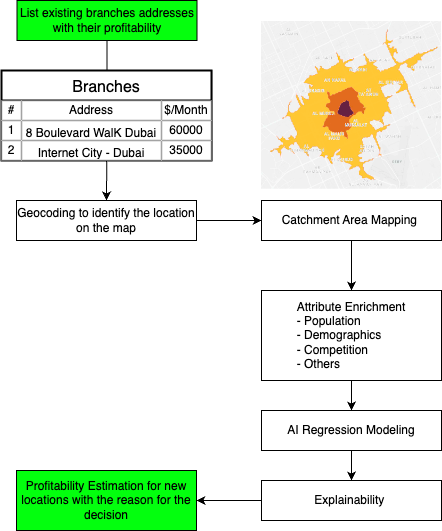
Step 2: Data Collection: Collect essential data such as demographics, spending power, population density, and amenities within the catchment area. Gather data from reliable sources like government statistics, public APIs, and relevant third-party datasets.
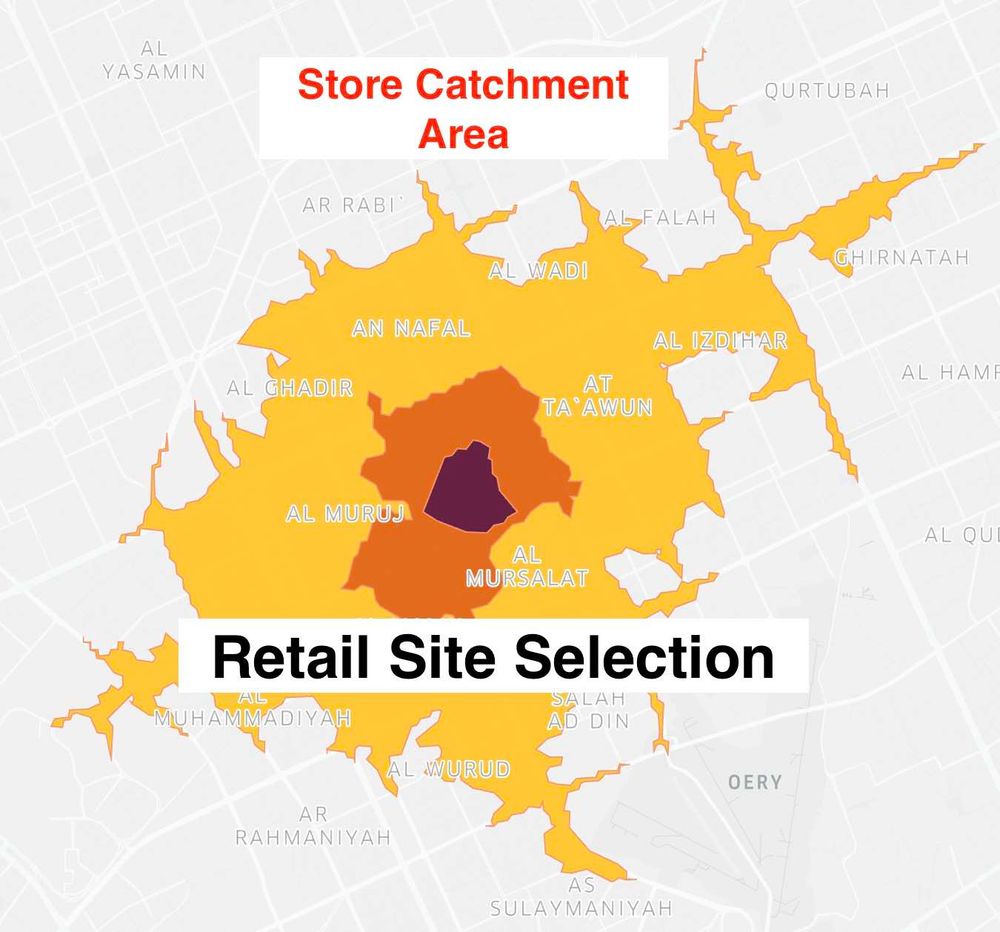
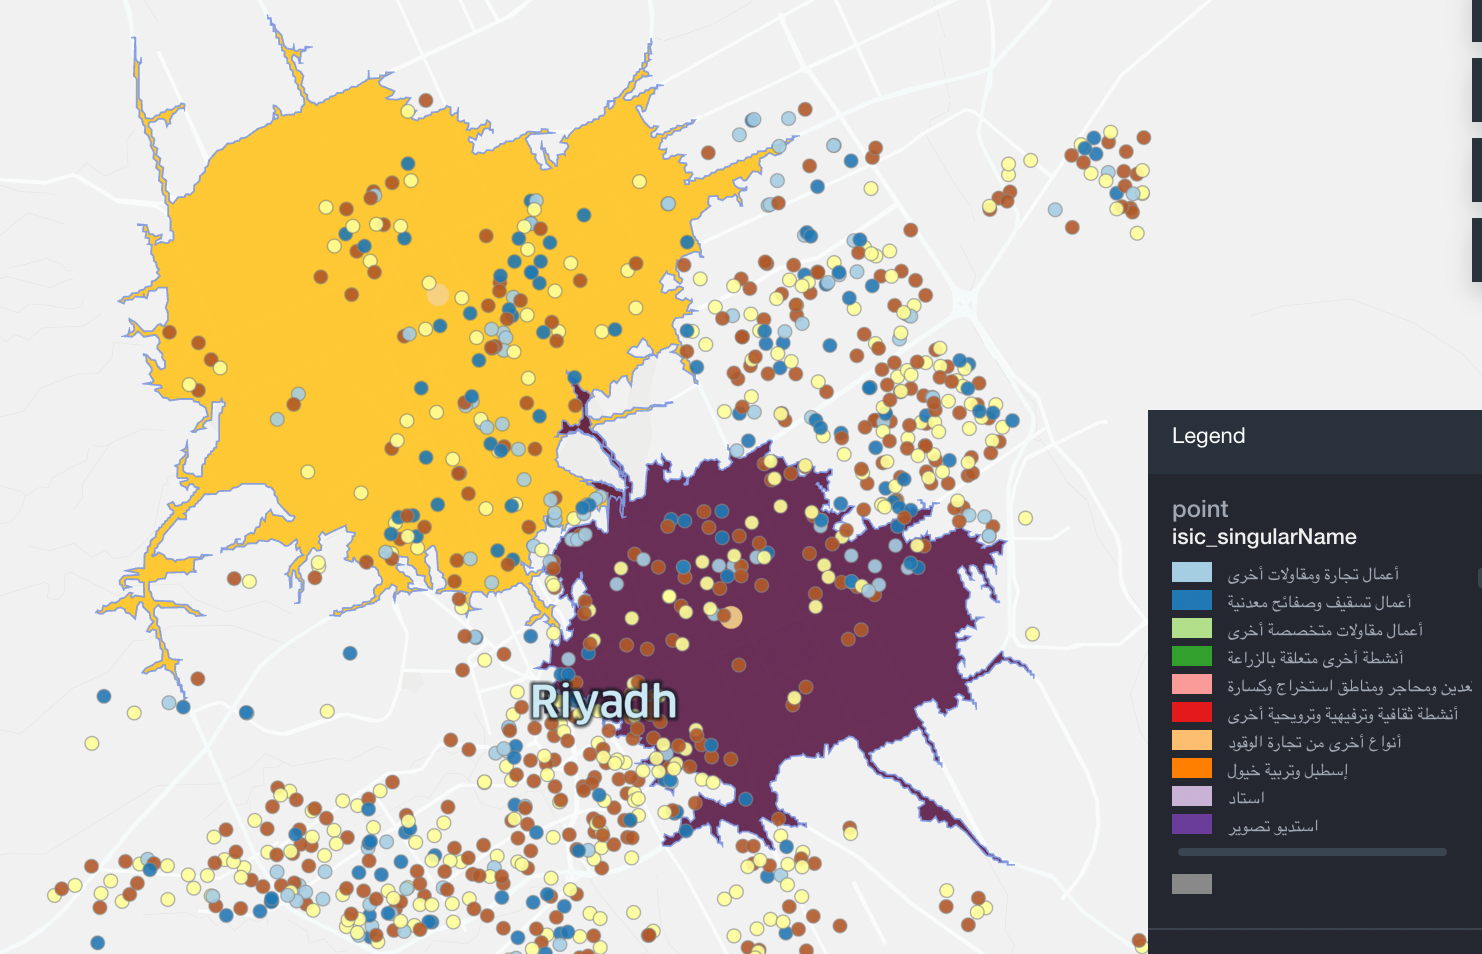
Step 3: Catchment Area Mapping: Use a mapping tool or API to generate isochrones that represent a driving radius from each existing store location. This creates a visual representation of the potential catchment area for the new location.
Step 4: Attribute Enrichment: Enhance the catchment area polygons with the data collected in Step 2, including population density, age distribution, and the presence of key amenities and competition
Step 5: Regression Model Development: Build a regression model for each existing store using the attributes within its catchment area. Choose an appropriate algorithm such as linear regression, leveraging historical store performance as your training data.
Step 6: Explainability: the performance of the regression model using techniques like cross-validation to ensure its accuracy and predictive power.
Step 7: Profitability Estimation: For the proposed new location, input the catchment area attributes into the regression model to estimate its potential profitability.
Choosing what data to include in the model is crucial and can heavily change the accuracy of the forecasting. Here are top datasets to use for retail site selection:
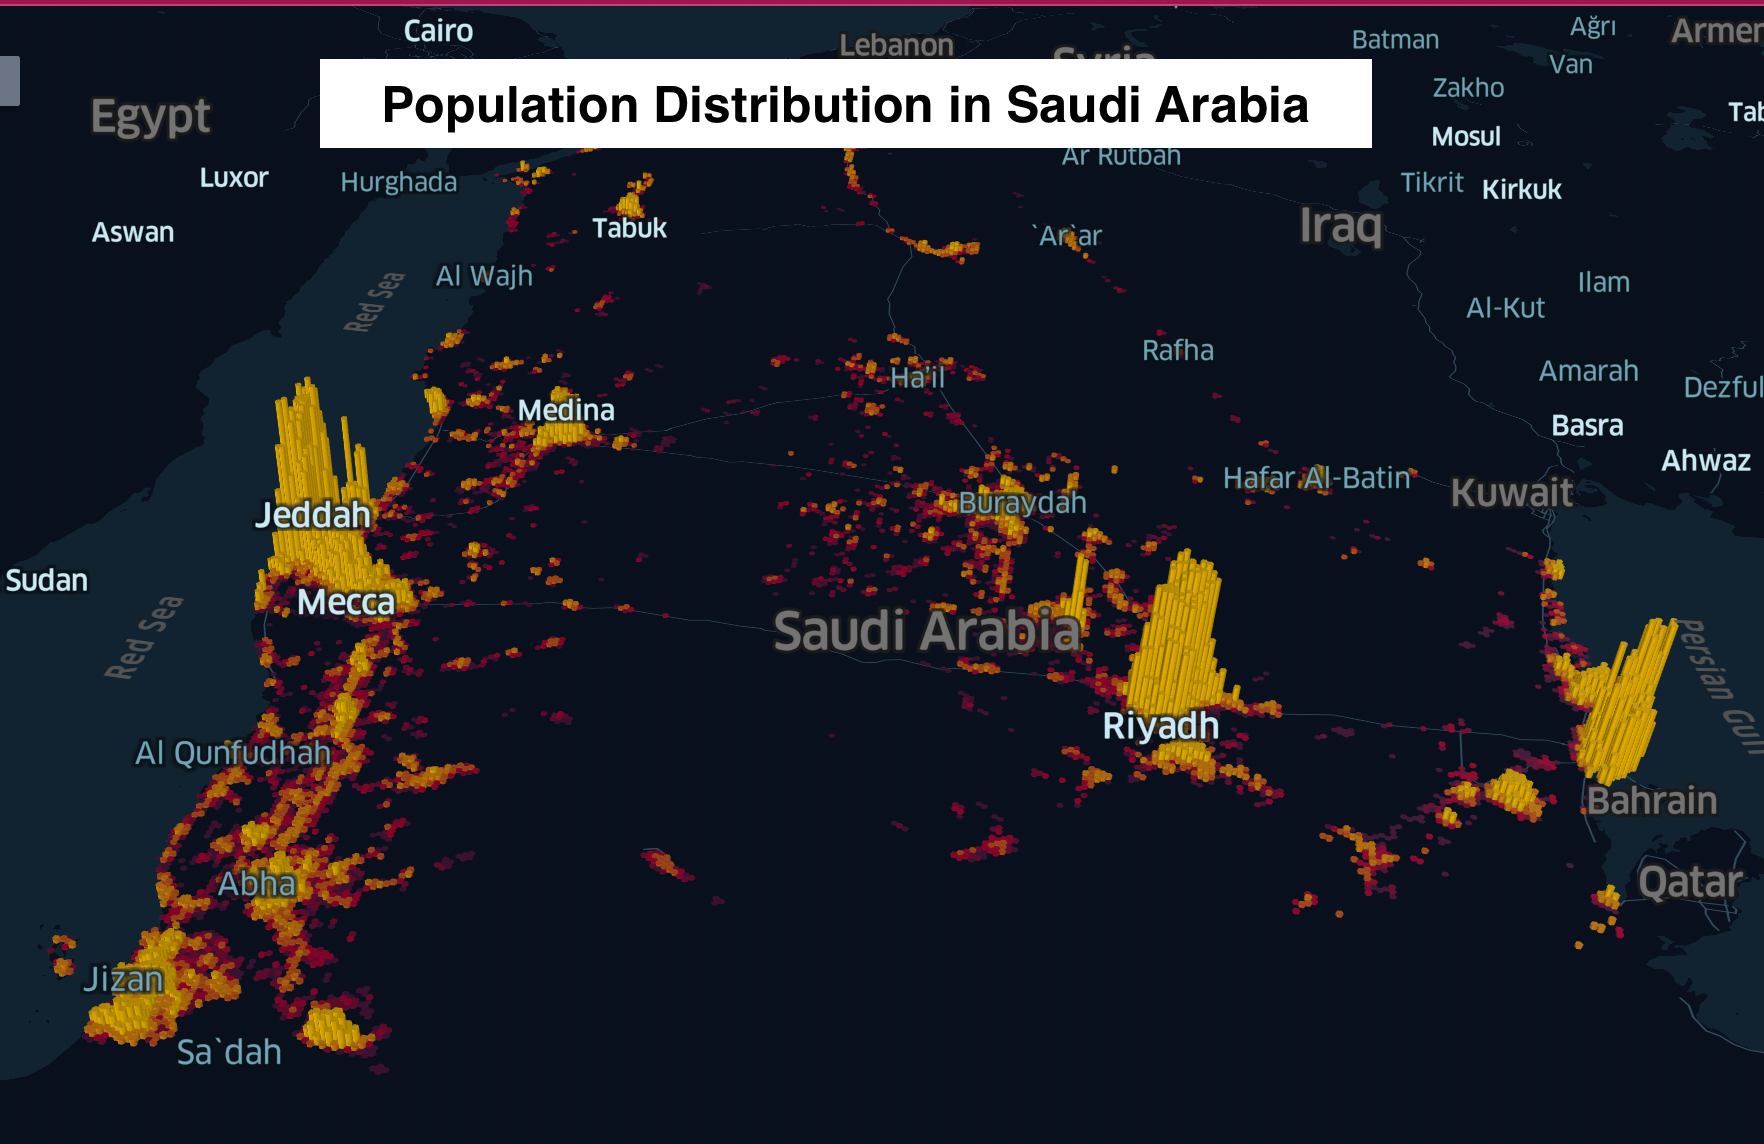
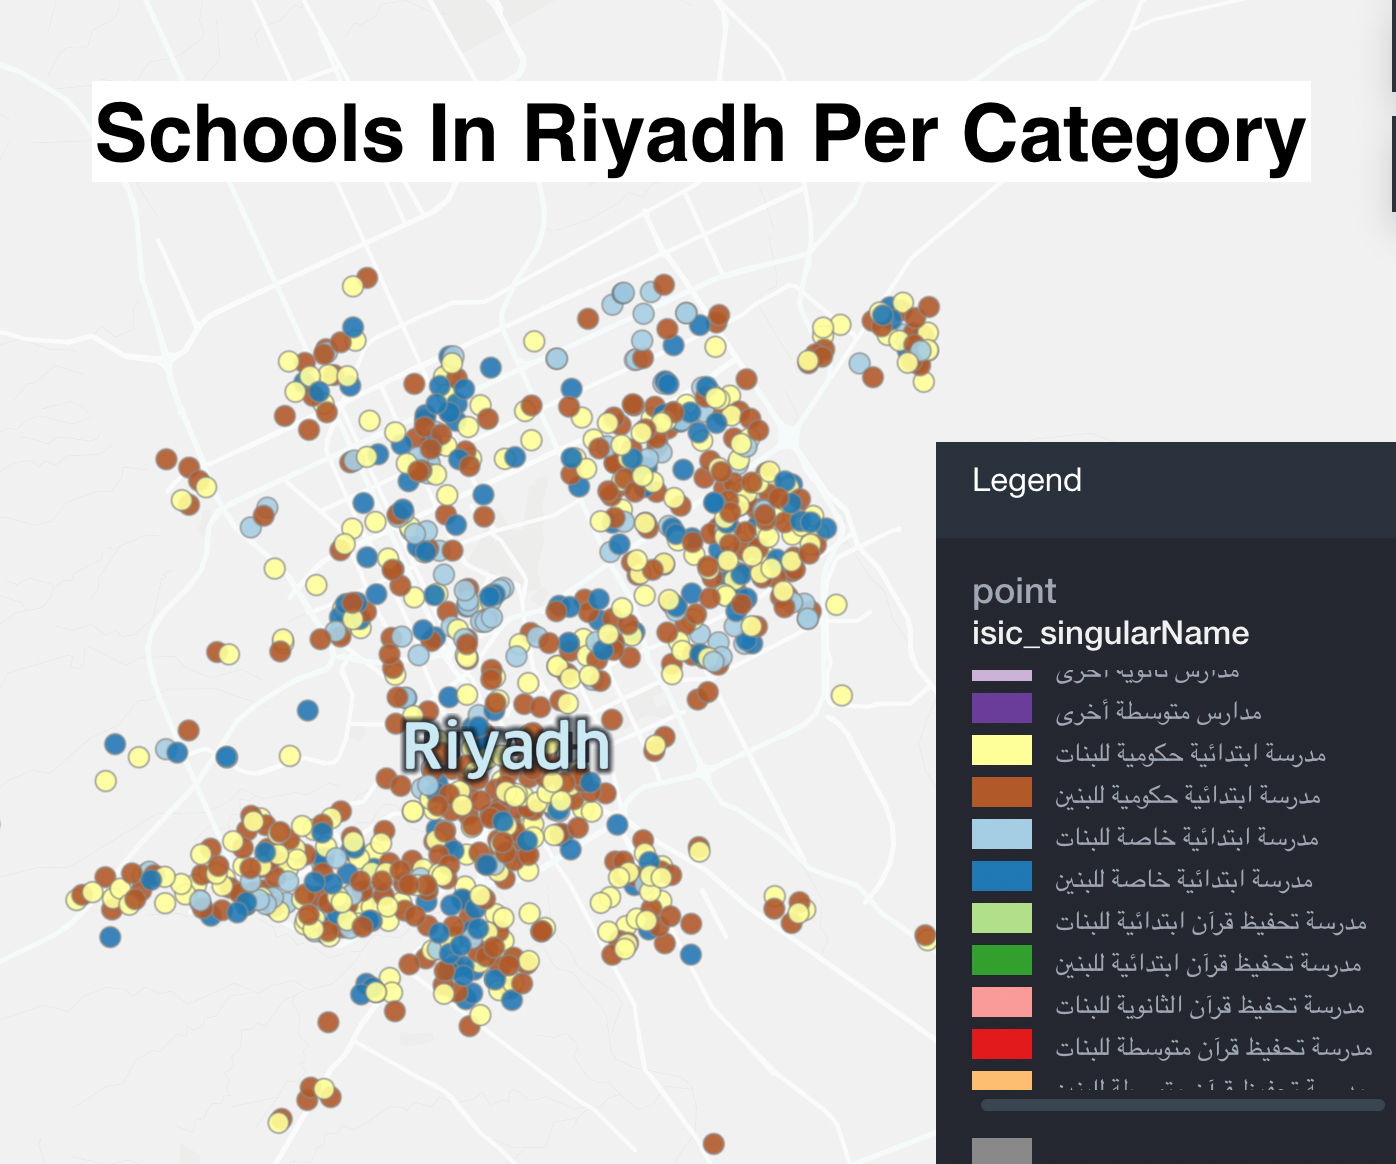
Population density, age distribution, gender distribution can help gauge the potential customer base.
Data on existing businesses in the area, their offerings, and customer reviews provide insights into market saturation and competition.
Geographic information system (GIS) data helps analyze factors like transportation, accessibility, and proximity to amenities.
Data on public transportation routes and stations helps assess accessibility.
Availability of schools, parks, shopping centers, and entertainment venues impact foot traffic.
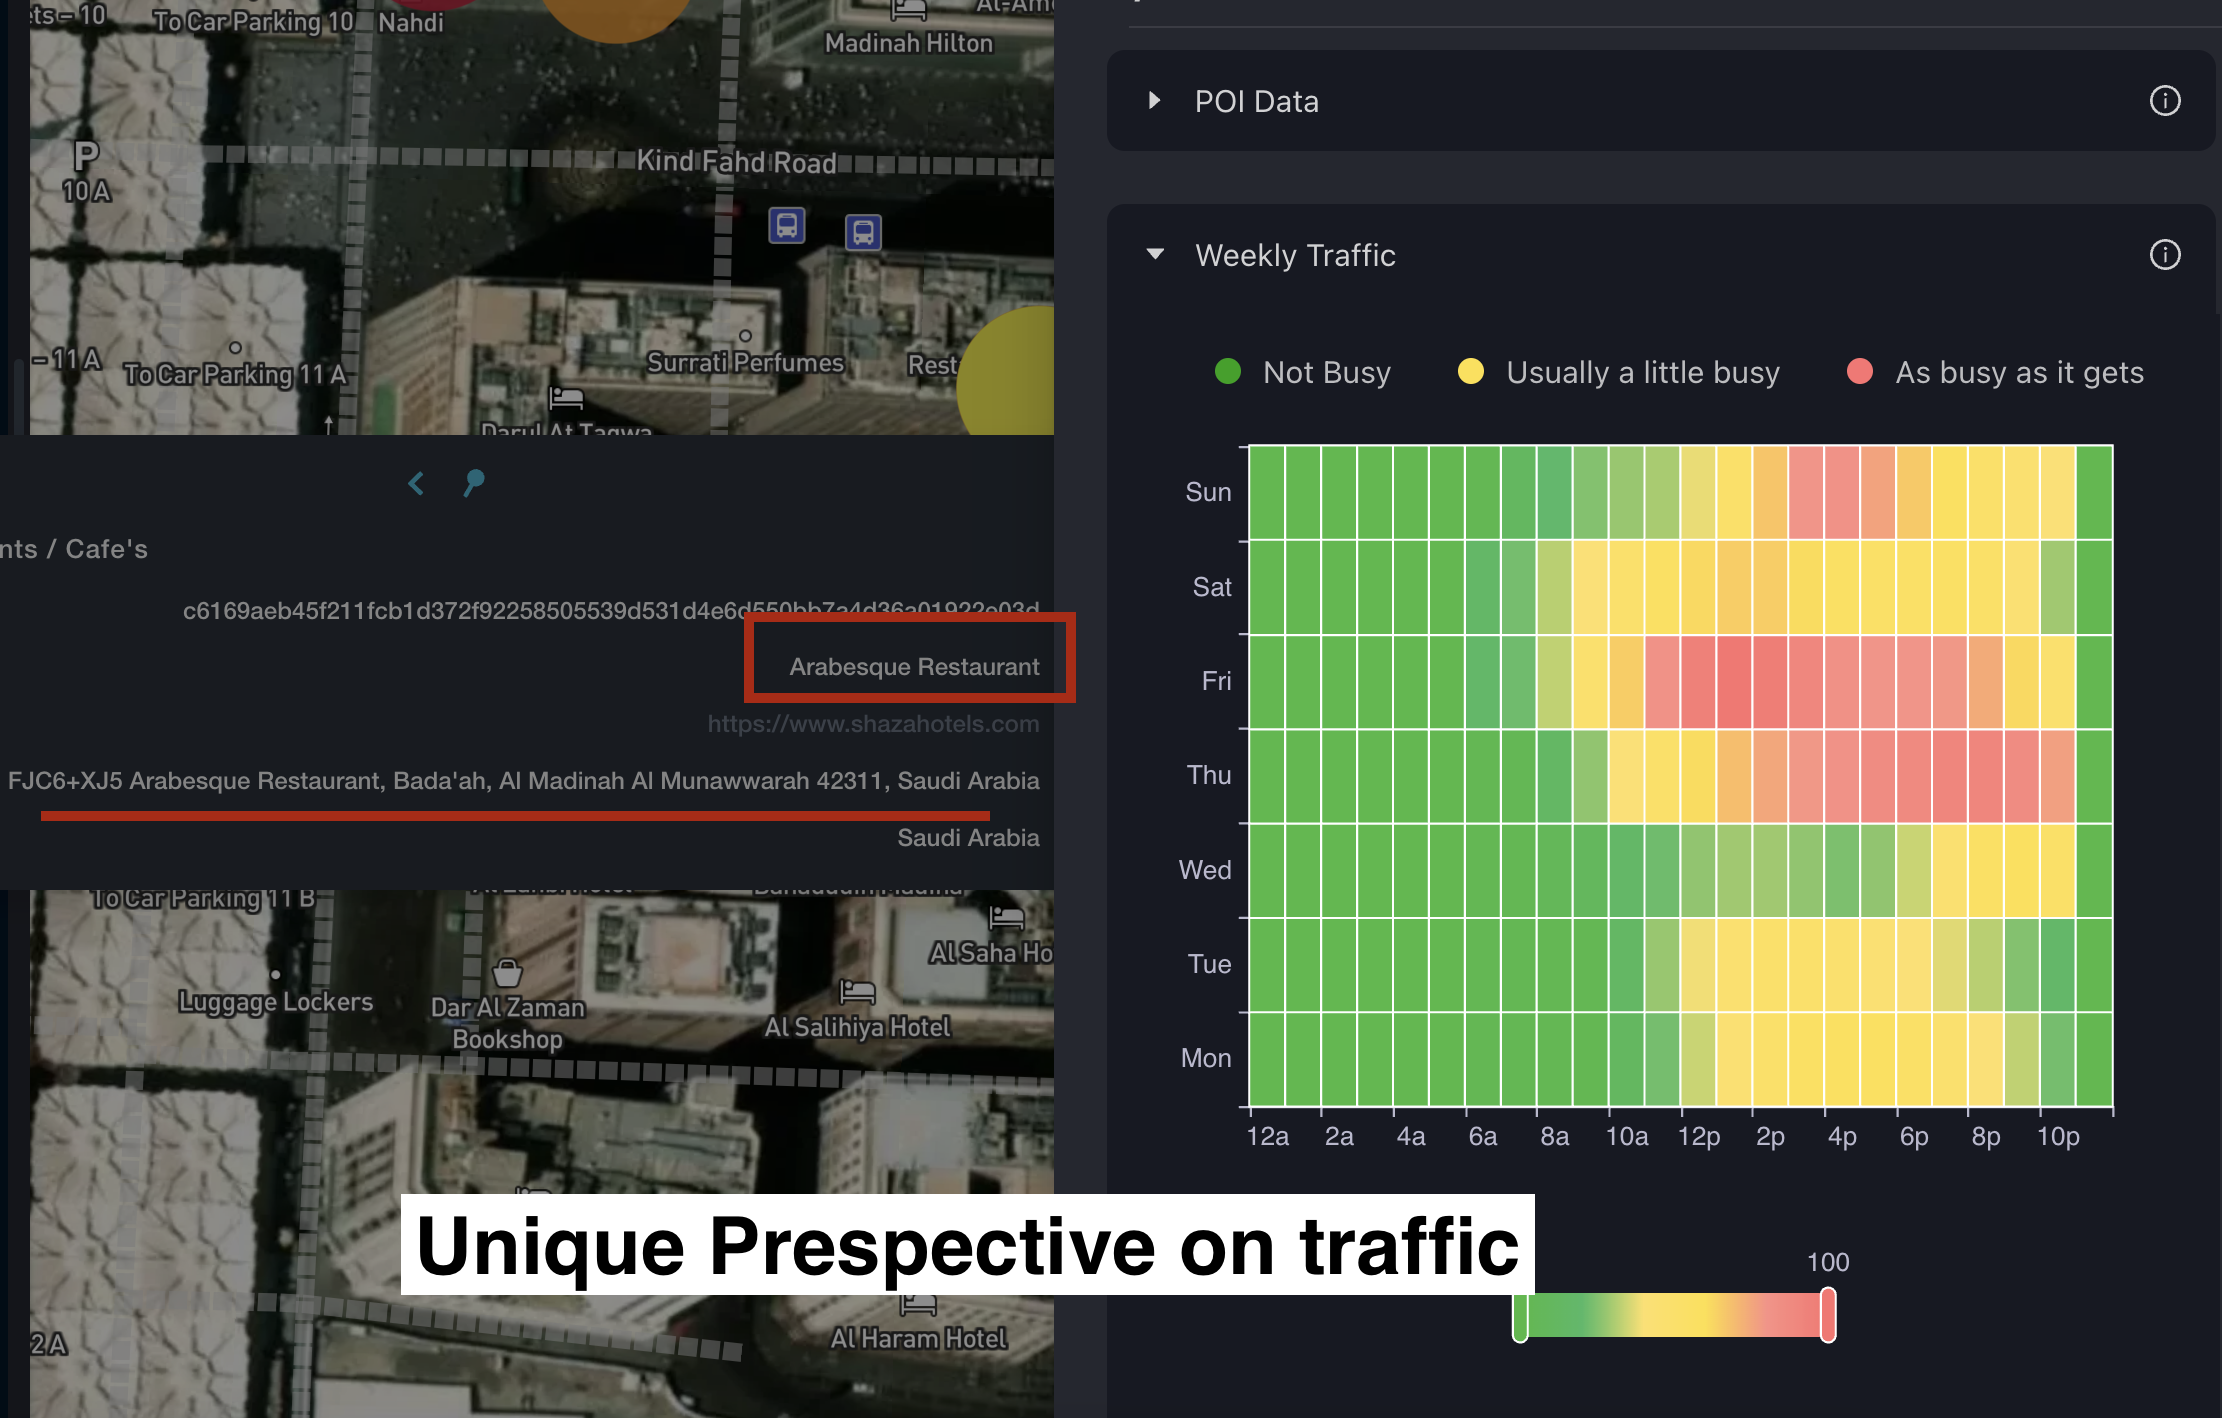
Insights into pedestrian and vehicular traffic patterns help evaluate a location's visibility and accessibility.
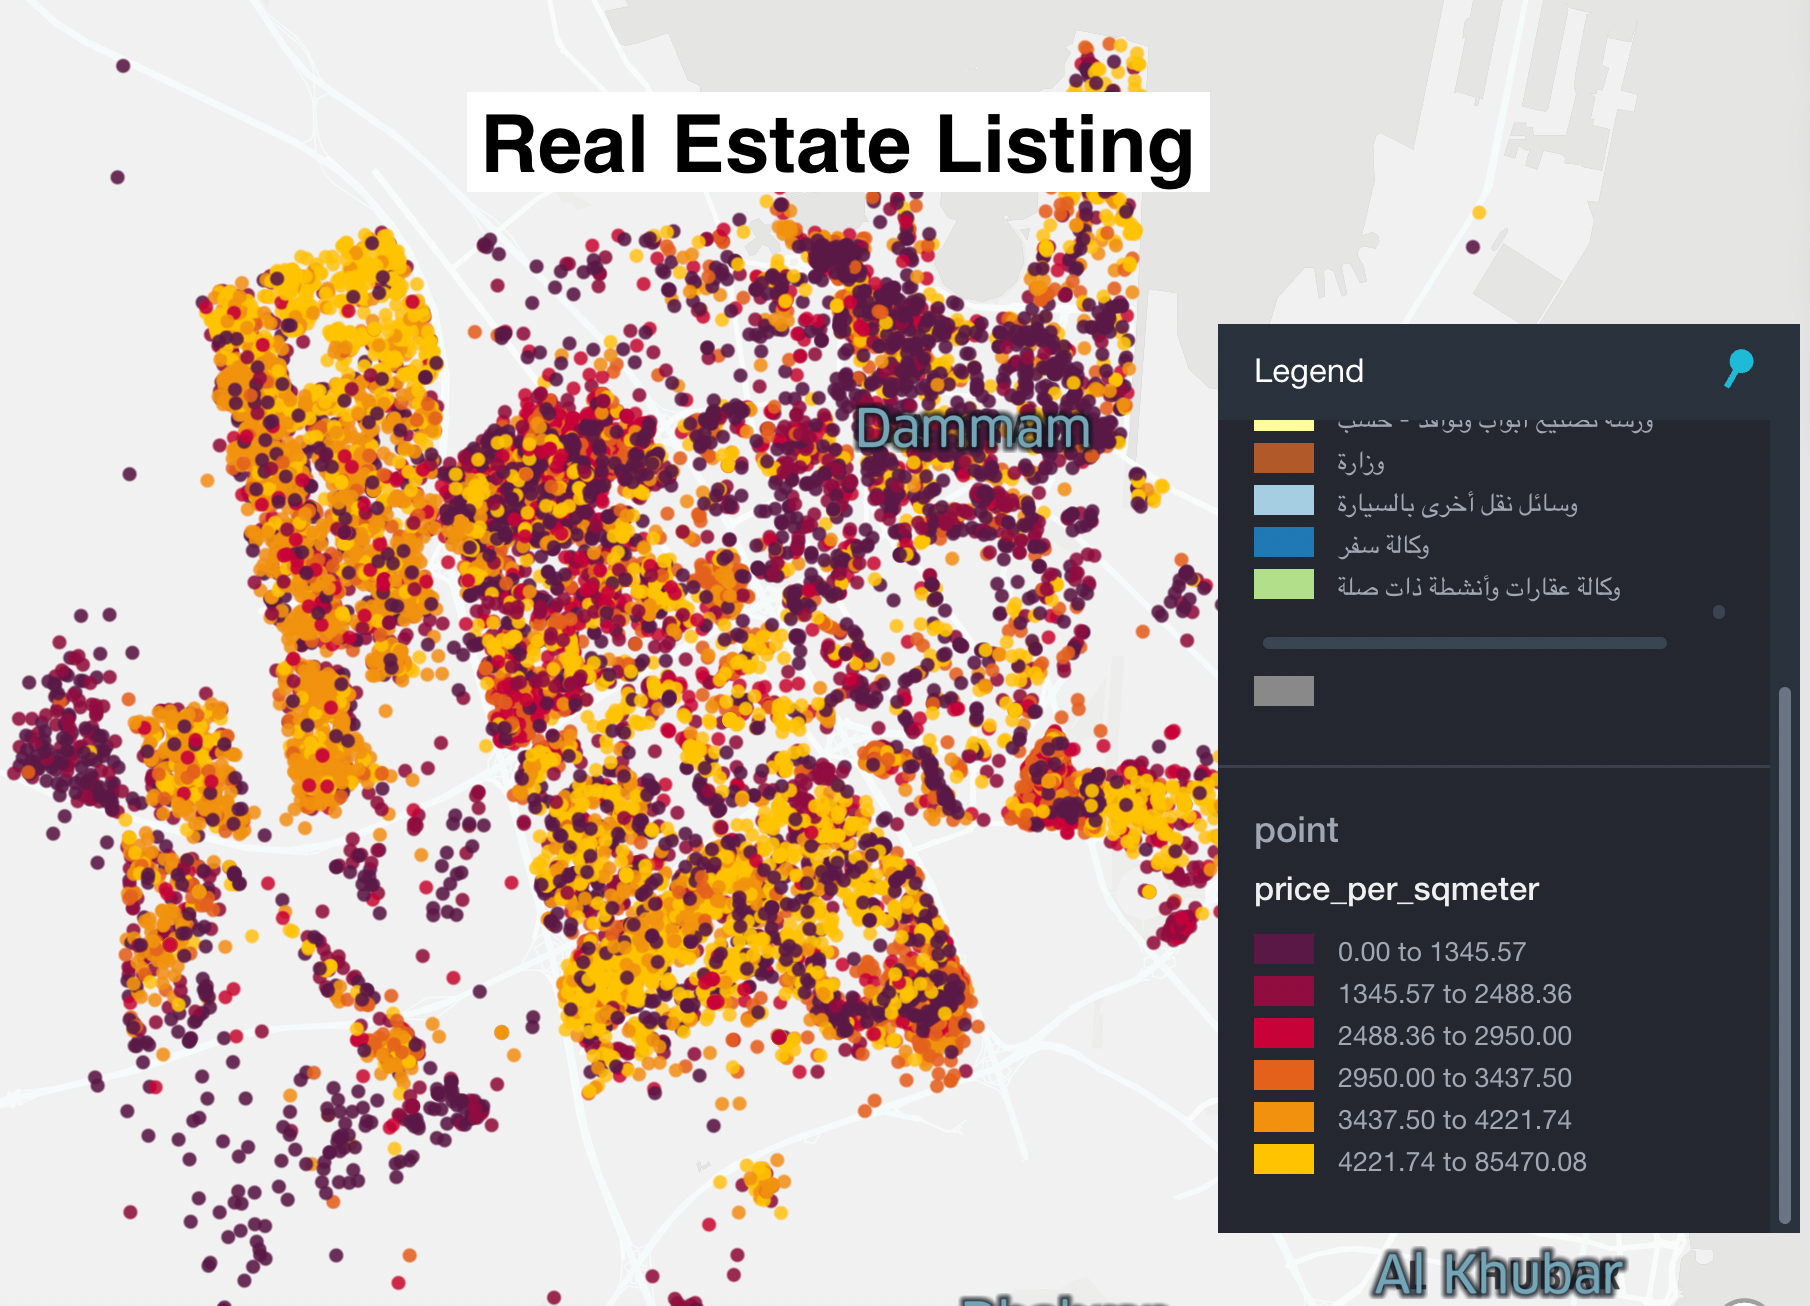
Property prices, availability, and lease rates give an understanding of costs and options.
Information on local economic health, employment rates, and consumer confidence impacts purchasing power.
Social media data provides sentiments, discussions, and trends around a potential location.
Understanding local regulations, permits, and zoning laws is crucial for legal compliance.
Climate data helps anticipate seasonal trends that might affect foot traffic.
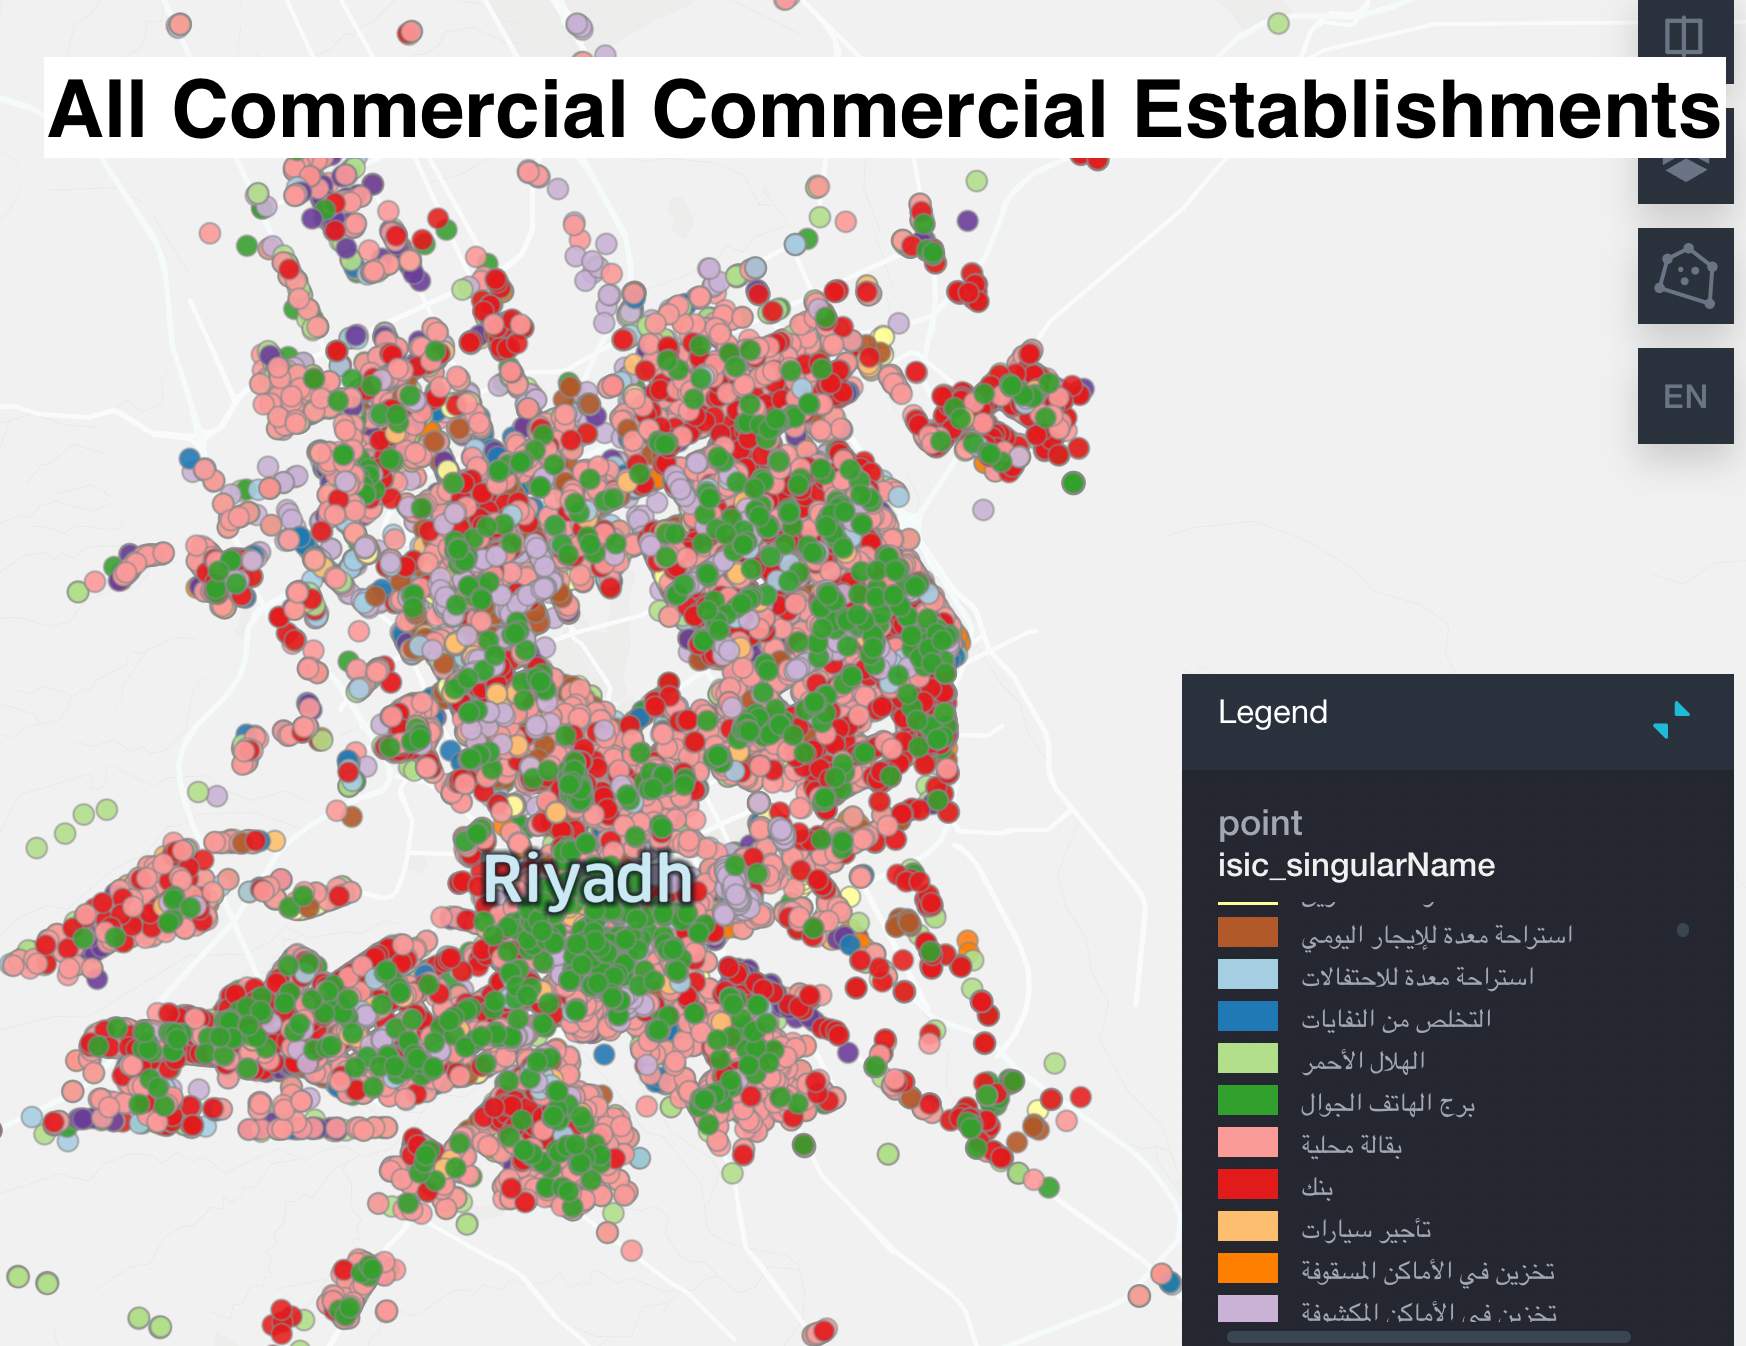
Points of interrest are places that exist in a specific area, weather it's shopping, dining, or transport hubs. Knowing what's in the area fully explain the characteristics of that area. Questions POI data help in answering:
Which types of businesses are prevalent in the area?
How much of the market the new store can capture initially?
How likely customers will keep coming?
How many competing businesses are nearby?
How easily customers can access the store?
When It comes to the model, Apply predictive modeling techniques to the data to create a model that can predict the potential success of a retail location. Some commonly used models include:
In the ever-evolving landscape of retail, understanding and overcoming location-based challenges is the key to thriving in new markets. By leveraging data-driven methodologies, like isochrone mapping, attribute population, and regression modeling, businesses can strategically position themselves for success. These techniques empower decision-makers to navigate the complexities of demographic diversity, changing trends, and competitive landscapes. With explainability at the forefront, the relationship between data and strategic choices becomes transparent, enhancing the confidence to forecast profitability accurately.

Whatever your goal or project size, we will handle it.
We will ensure you 100% satisfication.
"We focus on delivering quality data tailored to businesses needs in the middle east. Whether you are a restaurant, a hotel, or even a gym, you can empower your operations' decisions with geo-data.”


