Exploring Road Traffic Data in France in 2024: Unlocking Insights

Understanding transportation systems can be complex, but analyzing traffic information from roadways provides valuable insights into societal mobility, infrastructure efficiency, and urban planning methods. France is well-known for its abundant cultural history and lively city hubs, offering an intriguing backdrop for studying the complexities of traffic on roads. This article delves into the complex system of French transport routes, analyzing the significance, beginnings, and impacts of road traffic information in a prominent European hub for transportation. Let's take a data-driven journey through France's road traffic, from busy Parisian streets to peaceful country roads.
The total length of roads in France spans an impressive 1,053,215 kilometers. This extensive network forms the backbone of transportation infrastructure, facilitating connectivity between cities, towns, and rural areas. The distance metric serves as a fundamental parameter for calculating travel times and optimizing route planning.
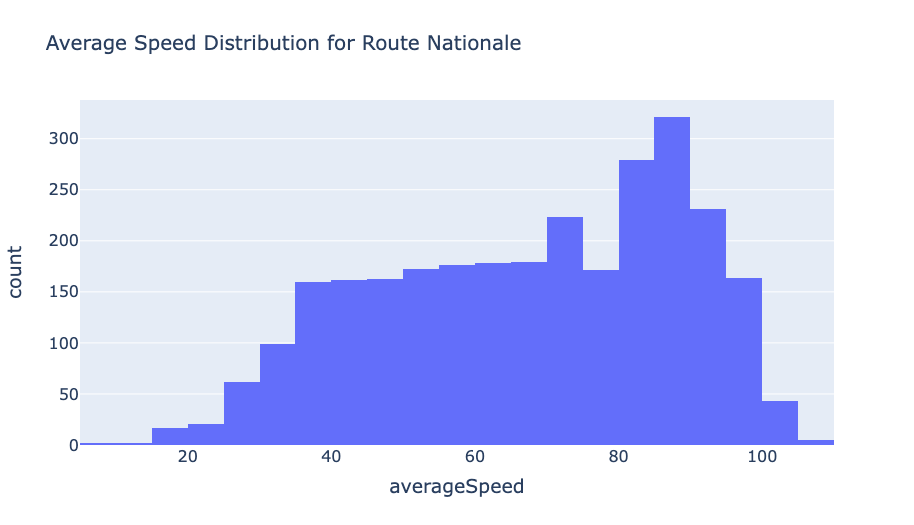
Understanding average speed is vital for assessing road network efficiency and traffic congestion levels. It offers insights into the typical rate of vehicle travel on various road segments, enabling authorities to identify congestion hotspots and implement targeted interventions. By analyzing average speed data, transportation planners can optimize traffic management strategies to improve overall mobility and reduce travel times. Graphical representations of average speed distribution for Route Nationale offer visual insights into speed dynamics, guiding efforts to enhance traffic flow and optimize infrastructure usage.
Speed limits play a crucial role in ensuring road safety and regulating traffic flow. In France, the maximum legally permitted speed varies across different road segments. A graph illustrating the speed limit distribution provides a comprehensive overview of speed regulations nationwide. Understanding speed limit patterns aids in enforcing traffic laws and implementing measures to mitigate accidents.

The FRC classification system categorizes roads based on their hierarchy and role in mobility. From major highways to local roads, each category serves distinct transportation needs. Analyzing the FRC distribution in France offers valuable insights into the composition of the road network and its impact on traffic management. By understanding FRC classifications, policymakers can prioritize infrastructure investments and optimize resource allocation.

Navigating France's intricate road network requires comprehensive data analysis coupled with intuitive visualizations. Graphs, maps, and specific insights into France's road traffic offer invaluable tools for understanding traffic patterns, optimizing routes, and enhancing transportation efficiency.
In any large city like Paris, the transportation management is faced with both challenges and opportunities due to the road network. Examining data on Paris' road network offers understanding on traffic congestion, transportation methods, and infrastructure usage in the city. Having knowledge of traffic flow in Paris is crucial for enhancing public transportation routes, enforcing traffic control tactics, and enhancing urban mobility.

The median speeds of streets offer insights into diverse traffic dynamics across different thoroughfares. Streets like Rue Celestin Hébert (13.85 km/h) and Sentier des Tartres (15.2 km/h) exhibit slower speeds, potentially indicating congestion. Meanwhile, boulevards such as Carrefour d'Alsace (16.5 km/h) and Boulevard Charles de Gaulle (16.55 km/h) show moderately faster speeds, suggesting smoother traffic flow. Highways like A5 (105 km/h) and A105 (106 km/h) boost significantly higher speeds, reflecting efficient movement along major routes. This data underscores the importance of strategic transportation planning to accommodate varied mobility needs.

Analyzing the average speeds by street name provides valuable insights into the varying traffic conditions across different thoroughfares. Streets like "La Francilienne" and "Route Départementale" consistently exhibit higher median speeds, suggesting generally faster traffic flow along these routes. This indicates efficient movement and possibly fewer congestion points along these roads. In contrast, streets like "Boulevard Périphérique," "Avenue du Général Leclerc," and "Avenue de la République" tend to have lower median speeds. This implies slower traffic flow and potentially more congestion along these urban thoroughfares. Understanding these patterns is essential for transportation planning and optimizing traffic management strategies to ensure smoother and more efficient mobility throughout the city.

Average speeds by Functional Road Class (FRC) offer crucial insights for transportation planning and traffic management. Motorways/freeways lead with around 80 km/h, while other major roads maintain approximately 60 km/h. Secondary major roads follow at about 35 km/h, with local roads ranging from 25 to 35 km/h. Understanding these speed differentials across FRC categories is paramount for prioritizing infrastructure investments and implementing targeted interventions to enhance traffic flow and ensure the safety and efficiency of mobility networks.
By using road traffic information, France can introduce dynamic traffic solutions in urban areas to ease traffic jams and shorten travel times. By examining live traffic data and areas with heavy congestion, officials can implement techniques like adjusting traffic signals, managing lanes, and changing speed limits to enhance traffic flow and increase overall movement.
Analyzing road traffic information helps identify locations with many accidents and higher dangers, allowing for targeted measures to improve road safety. Authorities have the ability to use past accident information and traffic trends to develop data-based tactics, like enhancing road layout, improving signs, and focusing on enforcement, to reduce traffic accidents and enhance road safety results.
Understanding traffic information is crucial for steering the advancement of transportation infrastructure. Through the examination of traffic flow, road usage, and needs, priorities in infrastructure development such as road widening, intersection enhancements, and investments in public transportation can be identified by those in charge of decision-making. This will help decrease congestion, enhance links, and support the expansion of green urban areas.
Analyzing the road traffic data of France offers valuable understanding of the intricacies of transportation systems and urban transportation. Utilizing data analytics and visualization techniques allows stakeholders to make educated choices in improving traffic management, enhancing road safety, and optimizing infrastructure development. As France advances its transportation systems, road traffic data will continue to be crucial in determining the future of mobility throughout the country.
Through advanced visualization, xMap simplifies complex traffic data into intuitive maps and charts, facilitating quick decision-making and strategic planning. Its comprehensive data analysis capabilities provide detailed insights into traffic flow, speed limits, and median speeds, enabling businesses to optimize routes and logistics effectively. With continuous updates, xMap ensures access to reliable and up-to-date traffic data, empowering businesses to adapt promptly to changing conditions. Moreover, xMap offers predictive analytics tools to anticipate traffic patterns and minimize delays. Its user-friendly interface enhances accessibility, allowing stakeholders to extract actionable insights tailored to their objectives. In essence, xMap plays a crucial role in enhancing traffic management strategies and improving transportation efficiency in France.
To get all the details about France Traffic data, See this dataset page.
Or visit our catalog page.
If you’d like to data samples for other countries like Egypt, USA, Switzerland, Japan, Turkey, UAE, and others, please visit our platform and sign up.
This data is provided by LocationMind but the data source is TomTom


Whatever your goal or project size, we will handle it.
We will ensure you 100% satisfication.
"We focus on delivering quality data tailored to businesses needs in the middle east. Whether you are a restaurant, a hotel, or even a gym, you can empower your operations' decisions with geo-data.”


